Concept Maps
As concept map consists from conception-blocks and links between them, you can use ConceptDraw library objects and add to a document as much objects as you need. ConceptDraw tools let you to edit, group, move objects, change their appearance and add text signs and raster or vector pictures. ConceptDraw DIAGRAM diagramming and vector drawing software extended with Concept Maps Solution from the "Diagrams" Area is effective tool for creating professional looking Concept Maps.
 Concept Maps
The technique of concept mapping was developed as a constructive way of representing knowledge in science and increasing the meaningfulness of learning. Now, the creation of a concept map is extremely helpful when used in education as learning and teaching techniques that assist memorization. Concept maps are also used for idea generation in brainstorming sessions, and for detailing the structure of complex ideas.
The Best Mac Software for Diagramming or Drawing
ConceptDraw DIAGRAM is a powerful intelligent vector graphics engine that can be used to create basic diagrams including flowcharts, charts, workflows, flowcharts, organizational charts, business diagram, learn business diagrams, flow diagrams.
Column Chart Software
ConceptDraw Column Chart software allows drawing column charts using predesigned objects or drawing tools. In ConceptDraw Column Chart software you can find a complete set of column chart tools and objects.Applications
ConceptDraw DIAGRAM is a multipurpose software from ConceptDraw suite intended for diagramming, business and technical drawing, and visual documenting. You can reach a lot of practical benefits from the use of ConceptDraw DIAGRAM. The list of ConceptDraw DIAGRAM applications and versatile possibilities is extremely great. Among them network and system diagramming, business diagramming, Cisco network design, network visualization, software and database design, software development, business flowcharting, data flow design, databases modeling and visualization, business processes modeling, business drawing, technical drawing, GUI prototyping, Organizational charts construction, business processes fixing, web site planning and design, Internet solutions design, information architecture design, UML modeling, ER diagrams design, home and landscape design, and a lot of other applications. ConceptDraw DIAGRAM offers the users a beneficial collaboration, compatibility with MS Visio and many other popular programs, including other products from ConceptDraw suite.Network Visualization with ConceptDraw DIAGRAM
ConceptDraw makes the entire process of network visualization easier thanks to the numerous ready-to-use objects included in the package for presentation of network equipment, LDAP directory symbols and many other objects that symbolize resources in most various representations.
 Holiday
The Holiday Solution from Illustration area of ConceptDraw Solution Park contains holiday illustration examples, templates and vector clipart library.
 Venn Diagrams
Venn Diagrams are actively used to illustrate simple set relationships in set theory and probability theory, logic and statistics, mathematics and computer science, linguistics, sociology, and marketing. Venn Diagrams are also often used to visually summarize the status and future viability of a project.
Column Chart Examples
Column chart examples from ConceptDraw collection can help you find the best visual depiction for you data. You can easily modify column chart examples according to data you want to visualize.Radar Chart
This sample shows the Radar Chart that compares the internet dimensions in the four countries. The Radar Chart represents the multivariate data as a two-dimensional chart with three or more variables displayed on the axes that start in one point. The Radar Charts are used in the quality management, business, analytics and sport.Chart Examples
Easy charting software comes with beautiful chart templates and examples. This makes it easy to create professional charts without prior experience.
 Remote Presentation for Skype
This solution extends ConceptDraw MINDMAP software with the ability to collaborate via Skype.
Room planning with ConceptDraw DIAGRAM
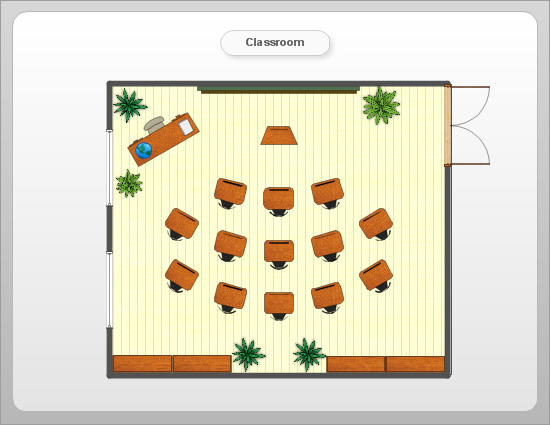
ConceptDraw will help you to create the room planning of any configuration quickly and skillfully. ConceptDraw contains a number of ready templates for creation of premises plans, and due to libraries with interior objects existing in the program you will be able to place furniture, denote the location of doors and windows and indicate dimensions.Software development with ConceptDraw DIAGRAM
Modern software development requires creation of large amount of graphic documentation, these are the diagrams describing the work of applications in various notations and cuts, also GUI design and documentation on project management. ConceptDraw DIAGRAM technical and business graphics application possesses powerful tools for software development and designing technical documentation for object-oriented projects. Solutions included to the Software Development area of ConceptDraw Solution Park provide the specialists with possibility easily and quickly create graphic documentation. They deliver effective help in drawing thanks to the included package of templates, samples, examples, and libraries with numerous ready-to-use vector objects that allow easily design class hierarchies, object hierarchies, visual object-oriented designs, flowcharts, GUI designs, database designs, visualize the data with use of the most popular notations, including the UML and Booch notations, easy manage the development projects, automate projection and development.Network Diagramming with ConceptDraw DIAGRAM
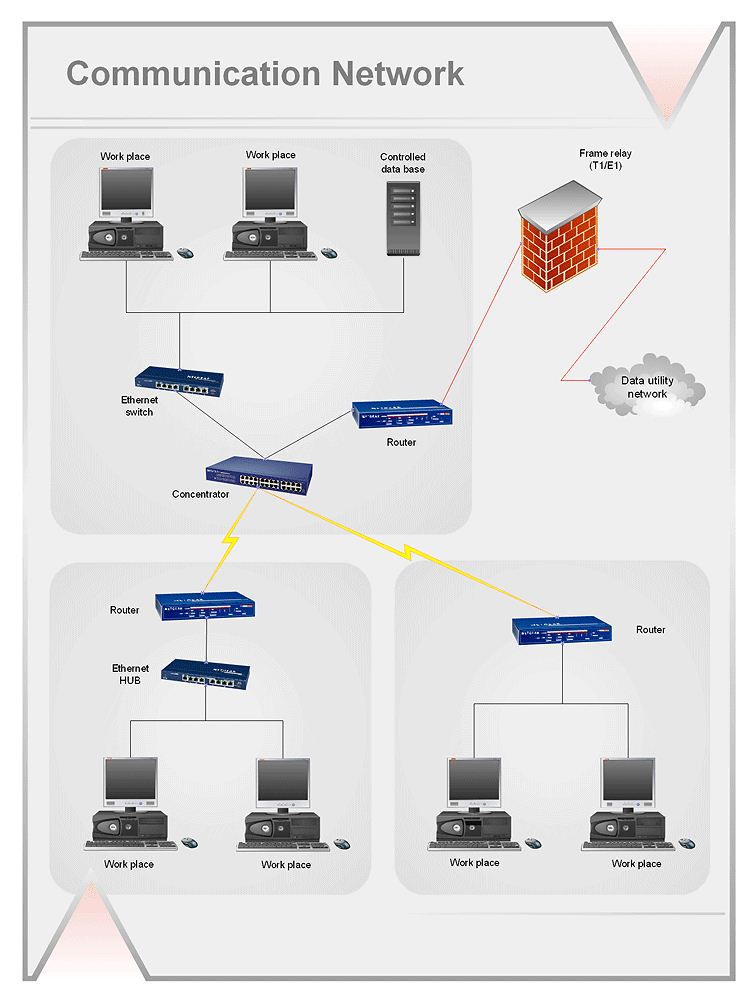
At the moment computer networks are widespread, various types of computer networks are constructed around the world, operate and interact with each other. There are many kinds of computer networks that differ in the transmission medium, in communications protocols, in size, topology, organizational intent, and also in territorial basis. There are popular such types of computer networks as Global Area Network (GAN), Wide Area Network (WAN), Metropolitan Area Network (MAN), Local Area Network (LAN). ConceptDraw DIAGRAM is a powerful network diagramming software, perfect for software engineers, software designers and software developers who need to draw Computer Network diagrams, designs, schematics, and network maps in no time. The pre-drawn shapes representing computers, network devices and smart connectors offered by ConceptDraw solutions help to create the accurate diagrams and documentation, represent computer network topologies and designs, depict Computer network architectures, logical, physical, cable networks, and vehicular networks.- Concept map - Internet marketing | SWOT matrix template | SWOT ...
- Concept map
- Concept map - Internet marketing | Concept maps with ...
- Concept map - Internet marketing | The Best Mac Software for ...
- Concept map - Internet marketing | Internet solutions with ...
- Concept maps with ConceptDraw PRO | Concept map - Internet ...
- Pyramid Chart Examples | Concept map - Internet marketing ...
- Concept map - Internet marketing | Marketing | SWOT matrix template |
- Concept map - Internet marketing | Marketing | Mind Maps for ...
- Concept map - Internet marketing | Concept maps with ...
- Concept maps with ConceptDraw PRO
- Concept maps with ConceptDraw PRO | Concept Maps | Concept ...
- Concept maps with ConceptDraw PRO | Bubble diagrams in ...
- Concept Maps | Mind Map Exchange | Basic Diagramming |
- Concept Maps | Concept maps with ConceptDraw PRO | Simple ...
- Concept maps with ConceptDraw PRO | Basic Diagramming ...
- What is SWOT Analysis in Marketing | Concept maps with ...
- Concept Maps
- Concept Maps | Concept maps with ConceptDraw PRO | Concept ...
- Concept maps with ConceptDraw PRO | Basic Diagramming ...


