Internet Connectivity. Computer and Network Examples

The 3D vertical bar graph sample shows the Iran internet users per 100 person from 2000 to 2011. It was designed on the base of the Commons Wikimedia file: Iran internet users per 100 person.png.
[commons.wikimedia.org/ wiki/ File:Iran_ internet_ users_ per_ 100_ person.png]
This file is licensed under the Creative Commons Attribution-Share Alike 3.0 Unported license. [creativecommons.org/ licenses/ by-sa/ 3.0/ deed.en]
The data source is World Bank: [data.worldbank.org/ country/ iran-islamic-republic]
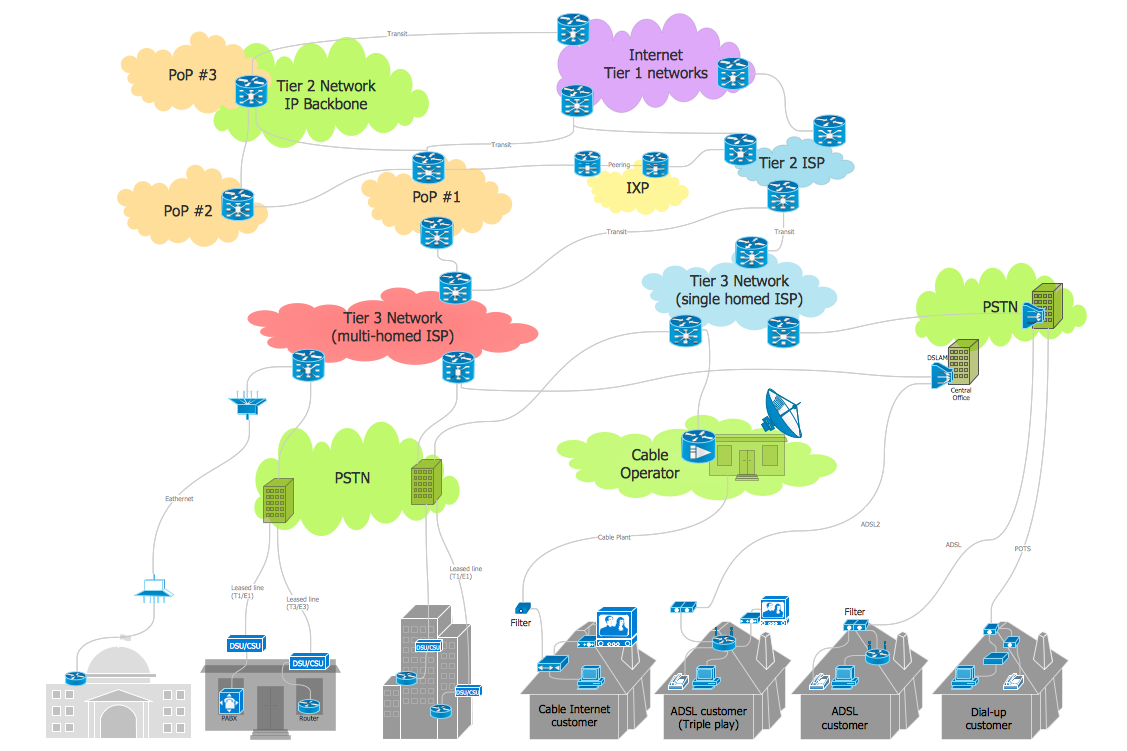
"In 1993 Iran became the second country in the Middle East to be connected to the Internet, and since then the government has made significant efforts to improve the nation's ICT infrastructure. Iran's national Internet connectivity infrastructure is based on two major networks: the public switched telephone network (PSTN) and the public data network. The PSTN provides a connection for end-users to Internet service providers (ISPs) over mostly digital lines and supports modem-based connections. The Data Communication Company of Iran (DCI), a subsidiary of TCI, operates the public data network." [Internet in Iran. Wikipedia]
The 3D column chart example "Iran internet users per 100 person" was created using the ConceptDraw PRO diagramming and vector drawing software extended with the Bar Graphs solution from the Graphs and Charts area of ConceptDraw Solution Park.
[commons.wikimedia.org/ wiki/ File:Iran_ internet_ users_ per_ 100_ person.png]
This file is licensed under the Creative Commons Attribution-Share Alike 3.0 Unported license. [creativecommons.org/ licenses/ by-sa/ 3.0/ deed.en]
The data source is World Bank: [data.worldbank.org/ country/ iran-islamic-republic]
"In 1993 Iran became the second country in the Middle East to be connected to the Internet, and since then the government has made significant efforts to improve the nation's ICT infrastructure. Iran's national Internet connectivity infrastructure is based on two major networks: the public switched telephone network (PSTN) and the public data network. The PSTN provides a connection for end-users to Internet service providers (ISPs) over mostly digital lines and supports modem-based connections. The Data Communication Company of Iran (DCI), a subsidiary of TCI, operates the public data network." [Internet in Iran. Wikipedia]
The 3D column chart example "Iran internet users per 100 person" was created using the ConceptDraw PRO diagramming and vector drawing software extended with the Bar Graphs solution from the Graphs and Charts area of ConceptDraw Solution Park.
3D Column chart

Network Topologies


Metropolitan area networks (MAN). Computer and Network Examples
. Computer and Network Examples")
HelpDesk
How to Add a Wireless Network Diagram to a PowerPoint Presentation

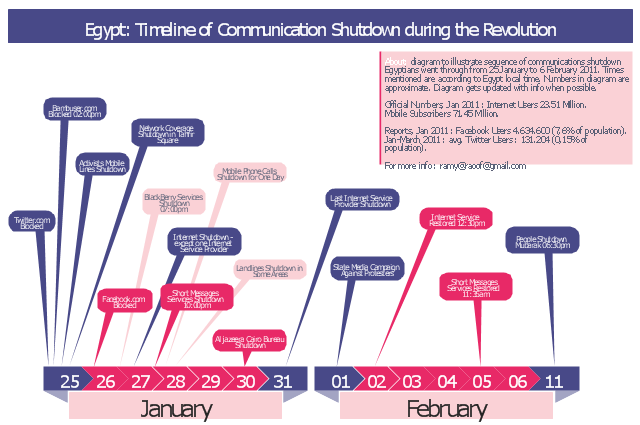
This typography infographics example was redesigned from the Wikimedia Commons file: Egypt timeline of communication shutdown during jan25revolution.jpg. [commons.wikimedia.org/ wiki/ File:Egypt_ timeline_ of_ communication_ shutdown_ during_ jan25revolution.jpg]
This file is licensed under the Creative Commons Attribution 3.0 Unported license. [creativecommons.org/ licenses/ by/ 3.0/ deed.en]
Diagram to illustrate sequence of communications shutdown Egyptians went through from 25 January to 06 February 2011. Times mentioned are according to Egypt local time. Numbers in the diagram are approximate. Last update of the diagram October 2011.
"2011 Internet shutdown.
Diagram to illustrate sequence of communications shutdown Egyptians went through from 25 January to 06 February 2011. Times mentioned are according to Egypt local time. Numbers in the diagram are approximate. Last update of the diagram October 2011.
The 2011 Egyptian protests began on 25 January 2011. As a result, on January 25 and 26, the government blocked Twitter in Egypt and later Facebook was blocked as well.
On January 27, various reports claimed that access to the Internet in the entire country had been shut down. ...
On February 2, connectivity was re-established by the four main Egyptian service providers. A week later, the heavy filtering that occurred at the height of the revolution had ended and bloggers and online activists who had been arrested were released." [Internet in Egypt. Wikipedia]
The example "Egypt timeline of communication shutdown during jan 25 revolution" was created using the ConceptDraw PRO diagramming and vector drawing software extended with the Typography Infographics solition from the area "What is infographics" in ConceptDraw Solution Park.
Infographics
"There are two definitions for wireless LAN roaming:
Internal Roaming (1): The Mobile Station (MS) moves from one access point (AP) to another AP within a home network because the signal strength is too weak. An authentication server (RADIUS) performs the re-authentication of MS via 802.1x (e.g. with PEAP). The billing of QoS is in the home network. A Mobile Station roaming from one access point to another often interrupts the flow of data among the Mobile Station and an application connected to the network. The Mobile Station, for instance, periodically monitors the presence of alternative access points (ones that will provide a better connection). At some point, based on proprietary mechanisms, the Mobile Station decides to re-associate with an access point having a stronger wireless signal. The Mobile Station, however, may lose a connection with an access point before associating with another access point. In order to provide reliable connections with applications, the Mobile Station must generally include software that provides session persistence.
External Roaming (2): The MS (client) moves into a WLAN of another Wireless Internet Service Provider (WISP) and takes their services (Hotspot). The user can independently of his home network use another foreign network, if this is open for visitors. There must be special authentication and billing systems for mobile services in a foreign network." [Wireless LAN. Wikipedia]
This Cisco roaming wireless local area network diagram example was created using the ConceptDraw PRO diagramming and vector drawing software extended with the Cisco Network Diagrams solution from the Computer and Networks area of ConceptDraw Solution Park.
WLAN diagram

Used Solutions
HelpDesk
How to Download ConceptDraw Products Through a Proxy Server

Network Glossary Definition

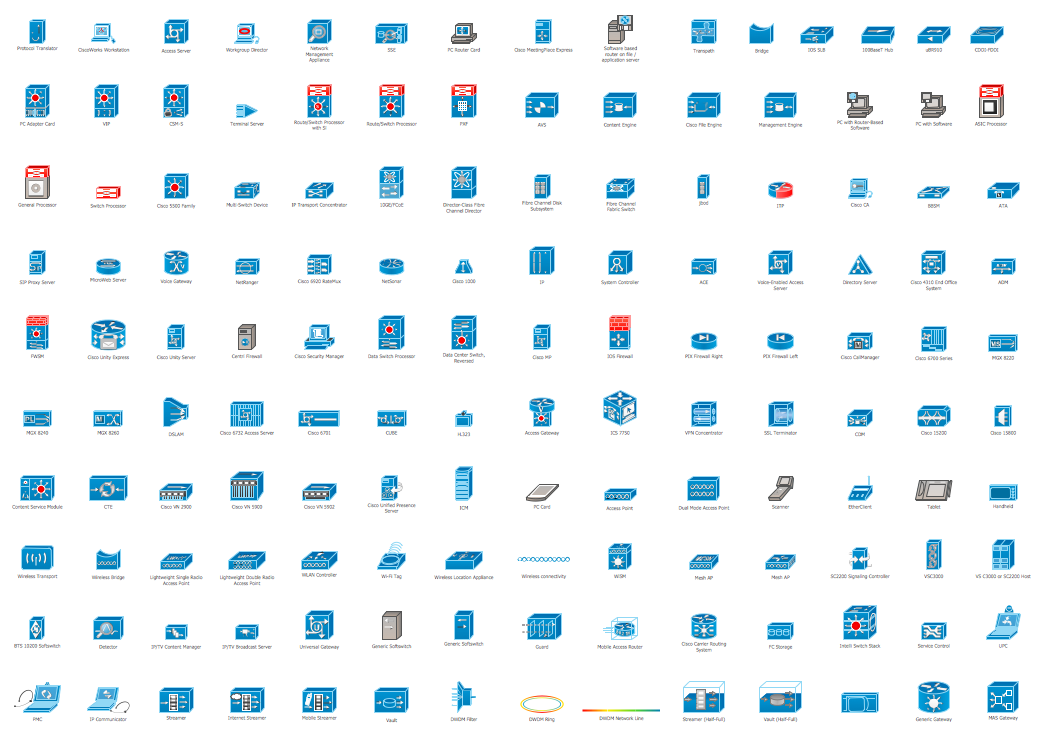
The vector stencils library "Cisco products additional" contains 141 symbols of computer network devices and equipment for drawing Cisco network diagrams.
The symbols example "Cisco products additional - Vector stencils library" was created using the ConceptDraw PRO diagramming and vector drawing software extended with the Cisco Network Diagrams solution from the Computer and Networks area of ConceptDraw Solution Park.
www.conceptdraw.com/ solution-park/ computer-networks-cisco
Protocol translator
CiscoWorks workstation
Access server
Workgroup director
Network management appliance
Storage Solution Engine (SSE)
-cisco-products-additional---vector-stencils-library.png--diagram-flowchart-example.png)
Software based router on file / application server
Cisco MeetingPlace Express
PC router card
Transpath
Bridge

IOS SLB
100BaseT hub
uBR910
CDDI-FDDI
PC adapter card
VIP
CSM-S
Terminal server
Route/Switch processor with Si
Route/Switch processor
PXF
AVS (Application Velicity System)
-cisco-products-additional---vector-stencils-library.png--diagram-flowchart-example.png)
Content engine (cache director)
-cisco-products-additional---vector-stencils-library.png--diagram-flowchart-example.png)
Cisco file engine
Management engine (ME 1100)
-cisco-products-additional---vector-stencils-library.png--diagram-flowchart-example.png)
PC with router-based software
PC with software
ASIC processor
Generic processor
Switch processor
Cisco 5500 family
Multi-switch device
IP transport concentrator
ITP
Cisco CA
Voice gateway
BBSM
ATA
SIP Proxy server
MicroWeb server

NetRanger
Cisco 6920 RateMux
NetSonar
Cisco 1000
IP
System controller
ACE
Voice-enabled access server (voice-enabled communications server)
-cisco-products-additional---vector-stencils-library.png--diagram-flowchart-example.png)
Directory server
Cisco 4310 end office system
ADM
FireWall Service Module (FWSM)
-cisco-products-additional---vector-stencils-library.png--diagram-flowchart-example.png)
Cisco Unity Express
Cisco Unity Server
Centri firewall
Cisco Security Manager
Data switch processor (AKA data center switch)
-cisco-products-additional---vector-stencils-library.png--diagram-flowchart-example.png)
Cisco MP
IOS firewall
PIX firewall, right
PIX firewall, left
CallManager
Cisco 6700 Series
MGX 8240
MGX 8220
MGX 8260
DSLAM
Cisco 6732 access server
Cisco 6701
H.323
Access gateway
ICS 7750
VPN concentrator
SSL terminator
CDM (Content Distribution Manager)
-cisco-products-additional---vector-stencils-library.png--diagram-flowchart-example.png)
Cisco 15200
Cisco 15800
Content Service Module
Content Transformation Engine (CTE)
-cisco-products-additional---vector-stencils-library.png--diagram-flowchart-example.png)
Cisco VN 2900
Cisco VN 5900
Cisco VN 5902
Cisco Unified Presence Server
ICM
PC card
Access point
Dual mode access point
EtherClient
Tablet
Wireless transport
Wireless bridge
Lightweight single radio access point
Lightweight Double Radio Access Point
WLAN controller
Wi-Fi tag
Wireless location appliance
Wireless connectivity

WiSM
Mesh AP
SC2200 Signaling Controller
Virtual Switch Controller (VSC3000)
-cisco-products-additional---vector-stencils-library.png--diagram-flowchart-example.png)
VS C3000 or SC2200 host
BTS 10200 Softswitch
Detector
IP/TV content manager
IP/TV broadcast server
Universal gateway

Generic softswitch
Generic Softswitch (blue)
-cisco-products-additional---vector-stencils-library.png--diagram-flowchart-example.png)
Guard
Mobile access router
Carrier Routing System (CRS)
-cisco-products-additional---vector-stencils-library.png--diagram-flowchart-example.png)
FC storage
Intelliswitch Stack
Service control
UPC (Unified Personal Communicator)
-cisco-products-additional---vector-stencils-library.png--diagram-flowchart-example.png)
PMC
IP communicator
Streamer
Vault
DWDM filter
DWDM ring
DWDM network line
Streamer (half-full)
-cisco-products-additional---vector-stencils-library.png--diagram-flowchart-example.png)
Vault (half-full)
-cisco-products-additional---vector-stencils-library.png--diagram-flowchart-example.png)
Data center switch, reversed
Scanner
10GE/FCoE
car
CUBE
Director-class fibre channel director
Fibre channel disk subsystem
Fibre channel fabric switch
Generic gateway
Handheld
Internet streamer
JBOD

MAS gateway
Mesh AP
Mobile streamer
 ConceptDraw Solution Park
ConceptDraw Solution Park collects graphic extensions, examples and learning materials
Cisco Products Additional. Cisco icons, shapes, stencils and symbols
"General packet radio service (GPRS) is a packet oriented mobile data service on the 2G and 3G cellular communication system's global system for mobile communications (GSM). GPRS was originally standardized by European Telecommunications Standards Institute (ETSI) in response to the earlier CDPD and i-mode packet-switched cellular technologies. It is now maintained by the 3rd Generation Partnership Project (3GPP).
GPRS usage is typically charged based on volume of data transferred, contrasting with circuit switched data, which is usually billed per minute of connection time. Usage above the bundle cap is either charged per megabyte or disallowed.
GPRS is a best-effort service, implying variable throughput and latency that depend on the number of other users sharing the service concurrently, as opposed to circuit switching, where a certain quality of service (QoS) is guaranteed during the connection. In 2G systems, GPRS provides data rates of 56–114 kbit/ second. 2G cellular technology combined with GPRS is sometimes described as 2.5G, that is, a technology between the second (2G) and third (3G) generations of mobile telephony. It provides moderate-speed data transfer, by using unused time division multiple access (TDMA) channels in, for example, the GSM system. GPRS is integrated into GSM Release 97 and newer releases." [General Packet Radio Service. Wikipedia]
This GPRS network diagram example was created using the ConceptDraw PRO diagramming and vector drawing software extended with the Telecommunication Network Diagrams solution from the Computer and Networks area of ConceptDraw Solution Park.
GPRS network diagram

The vector stencils library "Cisco products additional" contains 141 symbols of computer network devices and equipment for drawing Cisco network diagrams.
The symbols example "Cisco products additional - Vector stencils library" was created using the ConceptDraw PRO diagramming and vector drawing software extended with the Cisco Network Diagrams solution from the Computer and Networks area of ConceptDraw Solution Park.
www.conceptdraw.com/ solution-park/ computer-networks-cisco
The symbols example "Cisco products additional - Vector stencils library" was created using the ConceptDraw PRO diagramming and vector drawing software extended with the Cisco Network Diagrams solution from the Computer and Networks area of ConceptDraw Solution Park.
www.conceptdraw.com/ solution-park/ computer-networks-cisco
Protocol translator
CiscoWorks workstation
Access server
Workgroup director
Network management appliance
Storage Solution Engine (SSE)
Software based router on file / application server
Cisco MeetingPlace Express
PC router card
Transpath
Bridge
IOS SLB
100BaseT hub
uBR910
CDDI-FDDI
PC adapter card
VIP
CSM-S
Terminal server
Route/Switch processor with Si
Route/Switch processor
PXF
AVS (Application Velicity System)
Content engine (cache director)
Cisco file engine
Management engine (ME 1100)
PC with router-based software
PC with software
ASIC processor
Generic processor
Switch processor
Cisco 5500 family
Multi-switch device
IP transport concentrator
ITP
Cisco CA
Voice gateway
BBSM
ATA
SIP Proxy server
MicroWeb server
NetRanger
Cisco 6920 RateMux
NetSonar
Cisco 1000
IP
System controller
ACE
Voice-enabled access server (voice-enabled communications server)
Directory server
Cisco 4310 end office system
ADM
FireWall Service Module (FWSM)
Cisco Unity Express
Cisco Unity Server
Centri firewall
Cisco Security Manager
Data switch processor (AKA data center switch)
Cisco MP
IOS firewall
PIX firewall, right
PIX firewall, left
CallManager
Cisco 6700 Series
MGX 8240
MGX 8220
MGX 8260
DSLAM
Cisco 6732 access server
Cisco 6701
H.323
Access gateway
ICS 7750
VPN concentrator
SSL terminator
CDM (Content Distribution Manager)
Cisco 15200
Cisco 15800
Content Service Module
Content Transformation Engine (CTE)
Cisco VN 2900
Cisco VN 5900
Cisco VN 5902
Cisco Unified Presence Server
ICM
PC card
Access point
Dual mode access point
EtherClient
Tablet
Wireless transport
Wireless bridge
Lightweight single radio access point
Lightweight Double Radio Access Point
WLAN controller
Wi-Fi tag
Wireless location appliance
Wireless connectivity
WiSM
Mesh AP
SC2200 Signaling Controller
Virtual Switch Controller (VSC3000)
VS C3000 or SC2200 host
BTS 10200 Softswitch
Detector
IP/TV content manager
IP/TV broadcast server
Universal gateway
Generic softswitch
Generic Softswitch (blue)
Guard
Mobile access router
Carrier Routing System (CRS)
FC storage
Intelliswitch Stack
Service control
UPC (Unified Personal Communicator)
PMC
IP communicator
Streamer
Vault
DWDM filter
DWDM ring
DWDM network line
Streamer (half-full)
Vault (half-full)
Data center switch, reversed
Scanner
10GE/FCoE
car
CUBE
Director-class fibre channel director
Fibre channel disk subsystem
Fibre channel fabric switch
Generic gateway
Handheld
Internet streamer
JBOD
MAS gateway
Mesh AP
Mobile streamer
- Network wiring cable. Computer and Network Examples | Network ...
- Wireless broadband network diagram
- Internet solutions with ConceptDraw PRO | 3D Column chart - Iran ...
- 3D Column chart - Iran internet users per 100 person | Isp Chart
- Metropolitan area networks (MAN). Computer and Network Examples
- Column Chart Software | Column Chart Examples | How to Create a ...
- Person involvement matrix - Template | 3D Column chart - Iran ...
- Logical network diagram | Diagramming tool - Amazon Web ...
- Cisco Network Diagrams | Multiprotocol Label Switching (MPLS ...
- The Best Mac Software for Diagramming or Drawing | Design ...
- Local Area Network Diagram
- Bar Chart Software | Column Chart Software | Chart Maker for ...
- Cisco Network Diagrams | AWS Architecture Diagrams | Event ...
- Cisco Network Examples and Templates | Computer Network ...
- Organization chart - Foodbank | Horizontal Orgchart | Management ...
- Home area networks (HAN). Computer and Network Examples ...
- Wide area network (WAN) topology. Computer and Network Examples
- What Is The Systeam Of Local Area Phone Connectivity With Diagram
- Metropolitan Topology
- Diagrams Of Lan Man Wan