This site uses cookies. By continuing to browse the ConceptDraw site you are agreeing to our Use of Site Cookies.

Samples of Flowchart

This sample shows the Flowchart of the testing the work of the lamp and decision making about what to do to lamp will work.

Accounting Process

Accounting is a powerful tool used for gaining quantitative information about the finances. The accounting process is a series of activities which begins with a transaction and ends with closing of books, and includes recording the income and expenditure of an organization. ConceptDraw DIAGRAM diagramming and vector drawing software offers the Accounting Flowcharts Solution from the Finance and Accounting Area of ConceptDraw Solution Park which is perfect for accounting process visualization and for creation Accounting Process Flowcharts.

Sales Steps

Helps to create professionally looking and detailed Sales Flowcharts with all sales steps visually represented on them. Use the Sales Flowcharts Solution for ConceptDraw DIAGRAM software to create your own Sales Flowcharts of any complexity quickly, easily and effectively to use them successfully in your work activity. ConceptDraw DIAGRAM diagramming and vector drawing software supplied with unique Sales Flowcharts solution from the Marketing area of ConceptDraw Solution Park allows fast and easy visualize all sales steps of the sales process on a sales process Map or sales process flowchart, and then realize them easily.

Flowcharts

We have a lot of samples of flowchart diagrams for your needs.

Accounts Payable Process Flow Chart

Accounts Payable Process Flow Chart - ConceptDraw DIAGRAM diagramming and vector drawing software extended with Accounting Flowcharts Solution provides the useful tools that will help you create easily and quickly. The Accounts Payable Process Flow Chart is very popular and widely used type of accounting flowcharts. Now their designing is simple thanks to the Accounting Flowcharts Solution that provides the Accounting Flowcharts library of predesigned commonly-used shapes and a set of templates and samples.

Introduction to Cloud Computing Architecture

The best way to visualize the introduction to Cloud computing architecture is to create diagrams and schematics representing what is a cloud computing and how it works. For their design, we recommend to use a powerful ConceptDraw DIAGRAM diagramming and vector drawing software supplied with Cloud Computing Diagrams solution from the Computers and Network area of ConceptDraw Solution Park

Flowchart Components

The ConceptDraw Flowchart component includes a set of samples and templates. This geathered as flowchart maker toolbox which focused on drawing flowcharts of any industry standards.
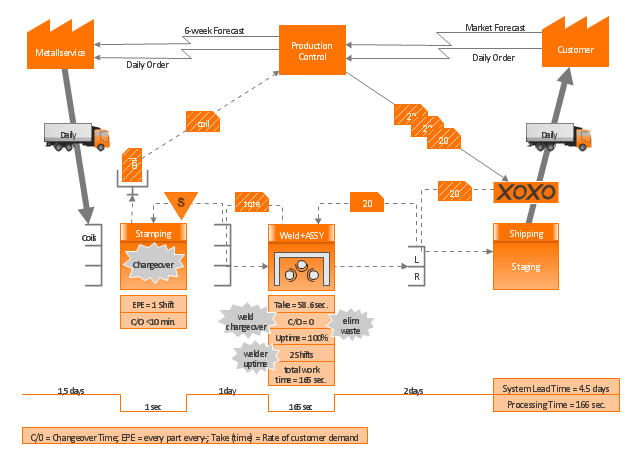
"Value Stream Map (VSM)
1. A tool used to improve a process by identifying added value and eliminating waste.
2. A process map that follows the value creation process.
A. “strap yourself to the product (or service) and see where you go”
3. A process map with data added.
A. Times: processing, wait, cycle.
B. Quality: number of rejects.
C. Inventory.
D. Resources.
1) Number of people.
2) Space.
3) Distance traveled.
E. Whatever else is useful for analyzing the process." [ocw.mit.edu/ courses/ aeronautics-and-astronautics/ 16-660j-introduction-to-lean-six-sigma-methods-january-iap-2012/ lecture-notes/ MIT16_ 660JIAP12_ 1-6.pdf]
This sample VSM flowchart shows the value stream in a manufacturing, production control and shipping processes.
This value stream mapping diagram example was created using the ConceptDraw PRO diagramming and vector drawing software extended with the Value Stream Mapping solution from the Quality area of ConceptDraw Solution Park.
Value stream mapping
Value stream mapping, workcell, truck shipment, logistics, timeline total, timeline, supermarket, signal Kanban, shipment, pull, production control, production Kanban, operator, material withdrawal Kanban, manual info, load levelling, electronic information flow, dedicated process, data box, customer, supplier, Kanban post, Kaizen burst,
HelpDesk

How to Open MS Visio® 2013-2019 Files on a Mac®

Powerful business graphics and diagramming tools is the norm and not the exception for today’s businesses. For years the de facto standard file format for business has been Microsoft Visio™. Many people involved in visual communication need software tools that will read and write using the Visio file format. With the introduction of Visio 2013, Microsoft has changed the native file format used in earlier versions of Microsoft Visio. ConceptDraw DIAGRAM v12 file import and export works round-trip with the new Visio VSDX file format.

Accounts Payable Flowchart

Accounts Payable Flowchart - There is nothing easier than do it in ConceptDraw DIAGRAM. ConceptDraw DIAGRAM diagramming and vector drawing software provides the Accounting Flowcharts Solution from the Finance and Accounting Area of ConceptDraw Solution Park. The Accounting Flowcharts Solution contains templates, samples and library of ready-to-use predesigned vector objects that will help you create: accounts payable flowchart, accounts payable process flow chart, accounting flowchart of any complexity quick and easy.

Data Flow Diagram Symbols. DFD Library

Data Flow Diagrams graphically represent the information transfers and process steps of a system. They visually depict how data are processed by a system in terms of inputs and outputs, how occurs the input in a system, how the data flow through an information system and where they are stored, and how occurs output from the system. DFDs give the overview of the system and models the processes aspects, they are maintained with other methods of structured systems analysis. The main goal of DFDs is achievement of understanding between developers and users. For their construction are used two notations - Gane-Sarson and Yourdon, each of them uses its own set of symbols. Data Flow Diagrams solution from Software Development area extends the ConceptDraw DIAGRAM software with templates, samples, and predesigned libraries of data flow diagram symbols for both notations, allowing you easy design the process-oriented and data-oriented models, draw the Data Flow Diagrams, Data Flowcharts, Data Process Diagrams, Information Flow Diagrams, Structured Analysis Diagrams, etc.

Marketing Charts

ConceptDraw DIAGRAM diagramming and vector drawing software offers the Marketing Diagrams Solution from the Marketing Area with extensive drawing tools, predesigned vector shapes, templates and samples for fast and easy drawing marketing charts and diagrams, marketing schemes and flow charts, various marketing illustrations, etc.

IT Security Solutions

Dynamic of development computer and network technologies increases the need in modern cyber security strategies and IT security solutions to support security of your data, to ensure data privacy, and to protect your operations from the cyber threats. Thanks to the Network Security Diagrams Solution from the Computer and Networks Area of ConceptDraw Solution Park, the ConceptDraw DIAGRAM diagramming and vector drawing software is one of the unique IT security solutions for professional designing Network Security Diagrams.

Sales Plan

The welfare of the entire company depends on the work of sales department, since the volume of sales sets the level of incomes. The realistic and competently composed sales plan is a component of success, prosperity and stability of the company. The sales plan will help to define specific goal for development of organization for a specified period of time and to define the boundaries of possibilities. The business inevitably faces with various contingencies, but the task of sales department is to maximize the use of existing resources for successful realizing the sales plan. When constructing the sales plan, you should carefully analyze the macroeconomic and political trends, to study the situation on the market and forecasts for dynamics, to take in account the results of competitors, to carefully consider results of work of sales department for the last years and the pace of company's development, to analyze the causes of growth or decline of sales in certain periods. Set the realistic goals and make the sales plan easily in ConceptDraw MINDMAP , don't forget to include to the budget the expenses on sales, such as the costs for advertising, supplies, salaries and bonuses. Save your plan in the form of presentation for easy discussion with other employees of the company.

logistics flow charts, logistics planning, logistics and supply chain, logistics management software, inventory flow chart Logistics Flow Charts

logistics flow charts, logistics planning, logistics and supply chain, logistics management software, inventory flow chart
Logistics Flow Charts solution extends ConceptDraw DIAGRAM functionality with opportunities of powerful logistics management software. It provides large collection of predesigned vector logistic symbols, pictograms, objects and clipart to help you design with pleasure Logistics flow chart, Logistics process flow diagram, Inventory flow chart, Warehouse flowchart, Warehouse management flow chart, Inventory control flowchart, or any other Logistics diagram. Use this solution for logistics planning, to reflect logistics activities and processes of an enterprise or firm, to depict the company's supply chains, to demonstrate the ways of enhancing the economic stability on the market, to realize logistics reforms and effective products' promotion.

What Is Information Architecture

What is information architecture? Information architecture (IA) is a broad and abstract term. At the most general sense the information architecture describes the structure of a system, how the different pieces of information are related at the system and represents their relationships. The information architecture term was introduced by Richard Saul Wurman in 1975 and now is commonly used in the context of websites and intranets, information structures and computer systems. ConceptDraw DIAGRAM extended with Enterprise Architecture Diagrams Solution from the Management Area is the best software for design information architecture and drawing Enterprise Architecture Diagrams.

How To Make Histogram in ConceptDraw DIAGRAM ?

How to make histogram in ConceptDraw DIAGRAM ? ConceptDraw DIAGRAM diagramming and vector drawing software is the best choice for making professional looking Histograms. ConceptDraw DIAGRAM provides Histograms solution from the Graphs and Charts Area of ConceptDraw Solution Park.

Structured Systems Analysis and Design Method. SSADM with ConceptDraw DIAGRAM

Structured Systems Analysis and Design Method (abbr. SSADM) is a method developed in Great Britain and accepted in 1993 as a national standard for information systems development and analysis. SSADM is based on Data Flow Diagrams and is characterized with presence of clear sequence of steps at projecting, analysis, and documenting of information system. It involves 6 main stages: analysis of existing system or estimation of practicability, requirements definition, determination of technical requirements and equipment cost, development of logical data model, projecting of logical requirements and specification them, physical projecting. Each of them is also divided into several steps defining the tasks that should be fulfilled at a given stage. The most important SSADM elements are flows modeling with help of DFD, data logic modeling with help of LDS (Logical Data Structure) and description of entities behavior. Applying of SSADM is easy with ConceptDraw DIAGRAM diagramming and vector drawing software and Data Flow Diagram solution.

Entity Relationship Diagram Software

The world-best Entity Relationship Diagram software suitable for professional ERD drawing is ConceptDraw DIAGRAM software extended with the Entity-Relationship Diagram (ERD) solution. This solution contains all libraries, templates and samples you may need for professional ERD drawing.

Venn Diagram

Venn diagrams are illustrations used in the branch of mathematics known as set theory. They show the mathematical or logical relationship between different groups of things (sets). A Venn diagram shows all the possible logical relations between the sets.