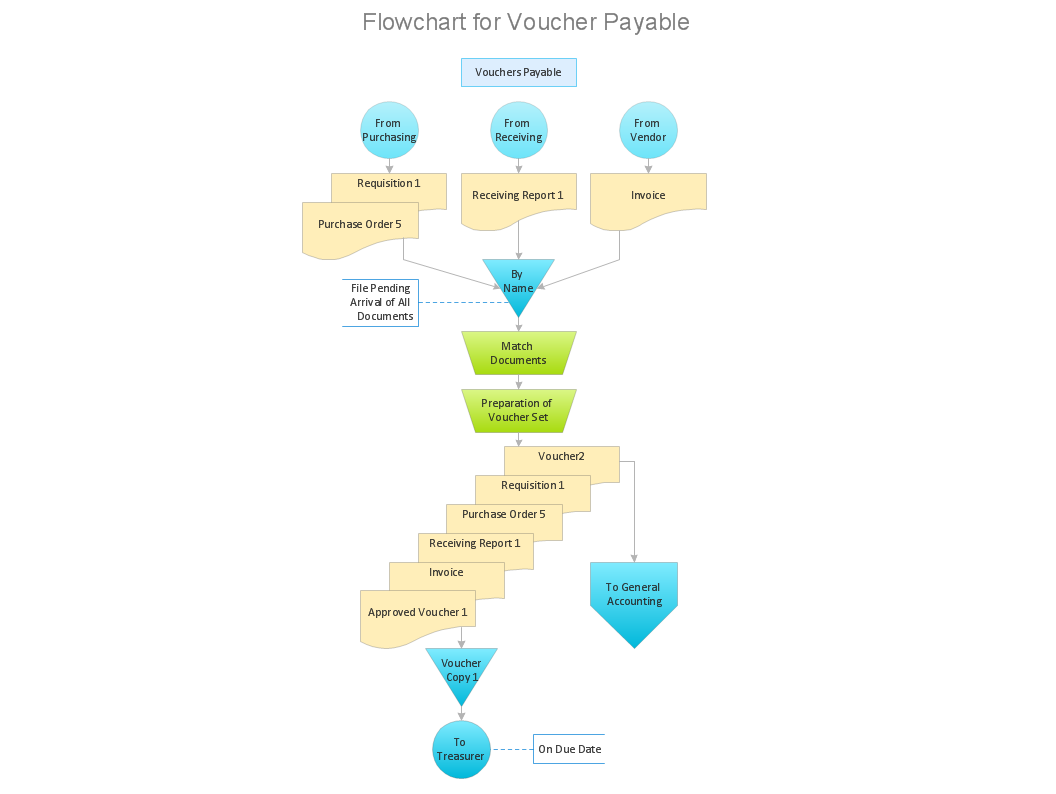
Approval Process and Segregation of Responsibilities Accounting Flowchart Example
How to build segregation of duties using drawing tools from Accounting Flowcharts Solution for ConceptDraw DIAGRAM software.Accounting Flowchart Symbols
Accounting is a well known and popular tool used for gaining full quantitative information about the finances. The accounting process includes extensive set of activities that begins with transactions and ends with closing of books. It contains all financial information for a given organization, the data about incomes, expenditures, purchases, sales, return, payroll, and many other numerical information. The excellent possibility to create great-looking Accounting Flowcharts is offered by professional ConceptDraw DIAGRAM diagramming and vector drawing software. It includes the Accounting Flowcharts solution containing wide variety of predesigned accounting flowchart symbols. All symbols are easy recognizable, commonly used, vector and professionally designed, so are capable effectively save your time and efforts when representing all stages of accounting work process, the flow of data in an organization, accounting procedures and processes, documents, tasks, responsible people, users, components and authorizations.Cross Functional Flowchart Examples
ConceptDraw DIAGRAM extended with Cross-Functional Flowcharts Solution from the Business Processes Area is a powerful software which offers a variety of Cross Functional Flowchart examples. The use of predesigned examples as the base for your own Cross Functional Flowchart Diagrams is a timesaving and useful way.Check Order Process Flowchart. Flowchart Examples
This sample was created in ConceptDraw DIAGRAM diagramming and vector drawing software using the Flowcharts solution from the Diagrams area of ConceptDraw Solution Park. This sample shows the Flowchart of the printing the elements of the binary search tree. They are printed in the order from lowest to greatest. On this diagram you can see the rectangles that represent the steps and decision points that are represented as diamonds with questions. It is necessary to make the decision that will determine the next step.Process Flow Chart Symbol
Process Flow Charts are very popular and widely used in chemical and process engineering for representation a general flow of plant processes and equipment. If you need often draw them, the ConceptDraw DIAGRAM diagramming and vector drawing software extended with tools of Flowcharts Solution will be useful for you. The mostly used set of process flow chart symbols includes the following: Rectangle (box) process flow chart symbol, Rounded rectangle, Circle, Diamond.Flow chart Example. Warehouse Flowchart
Warehouse Flowcharts are various diagrams that describe the warehousing and inventory management processes on the warehouses. Typical purposes of Warehouse Flowcharts are evaluating warehouse performance, measuring efficiency of customer service and organizational performance. This type of Workflow diagrams can be used for identifying any disconnection between business activities and business objectives. They are effectively used by warehouse-related people and organizations, manufacturers, wholesalers, exporters, importers, transporters, and others. Standard Warehousing process flow diagram and standard Workflow diagram are used for process identification for further evaluating effectiveness and profitability of overall business process. Use the ConceptDraw DIAGRAM ector graphic software extended with Flowcharts solution to design your own professional-looking Workflow diagrams and Flowcharts of any types, including the Warehouse flowchart, Process flow diagrams which depict in details all steps of Warehouse packages flow. Microsoft Visio, designed for Windows users, can’t be opened directly on Mac. But fortunately, there are several Visio alternatives for Mac which will help Mac users to work Visio files. With ConceptDraw DIAGRAM , you may open, edit and save files in Visio format.
Flowchart Components
The ConceptDraw Flowchart component includes a set of samples and templates. This geathered as flowchart maker toolbox which focused on drawing flowcharts of any industry standards.
Logistics Flow Charts
Logistics Flow Charts solution extends ConceptDraw DIAGRAM functionality with opportunities of powerful logistics management software. It provides large collection of predesigned vector logistic symbols, pictograms, objects and clipart to help you design with pleasure Logistics flow chart, Logistics process flow diagram, Inventory flow chart, Warehouse flowchart, Warehouse management flow chart, Inventory control flowchart, or any other Logistics diagram. Use this solution for logistics planning, to reflect logistics activities and processes of an enterprise or firm, to depict the company's supply chains, to demonstrate the ways of enhancing the economic stability on the market, to realize logistics reforms and effective products' promotion.
Process Flow Chart Examples
Process Flow Chart is a visual illustration of overall flow of activities in producing a product or service. How do you make a Process Flow Chart usually? Drawing process flow charts, diagrams and maps is quite complex and lengthy process, especially if you draw free-hand. But now thanks to the ConceptDraw DIAGRAM diagramming and vector drawing software extended with Flowcharts solution from the "Diagrams" area of ConceptDraw Solution Park this process became simple and fast. A confirmation of this can serve many Process Flow Chart examples included in Flowcharts solution.Sales Process Flowchart. Flowchart Examples
Sales Process Flowchart is an invaluable tool for business. It gives you opportunity to visualise and better understand the sales process, reveal and also visually highlight issues or bottlenecks, and predict the number of sales. The Flowchart is ideal method to represent in details all steps of the process, tasks and decisions needed to obtain maximum effectiveness and success. The steps are graphically represented by boxes linked with arrows indicating direction of the workflow, decision is shown by diamond. The sales process is closely linked to the company's success and usually includes the following main steps: Product knowledge, Prospecting, Planning the sale (Pre-approach), Approach, Need assessment, Presentation, Meeting objections, Gaining commitment, Follow-up. Create fast and easy your own Flowcharts of sales business processes using the ConceptDraw DIAGRAM ector graphic software extended with Cross-Functional Flowcharts solution from Business Processes area and also Sales Flowcharts solution from Marketing area of ConceptDraw Solution Park.- Logistics Flow Charts | Inventory Flow Chart In Retail Store
- How to Make a Logistics Flow Chart | Production Flow
- Sample Flow Chart For Logistics Processes
- Example Flowchart Of Inventory System
- Store Inventory Procedure Flow Chart
- LLNL Flow Charts | Draw Data Flow Diagrams Inventory System
- Event-driven Process Chain Diagrams | LLNL Flow Charts ...
- Inventory Process Flow Chart
- Flow chart Example. Warehouse Flowchart | Flowchart Marketing ...
- Logistics Flow Charts | Flow Chart Of Store In Inventory