Types of Flowcharts
A Flowchart is a graphical representation of process, algorithm, workflow or step-by-step solution of the problem. It shows the steps as boxes of various kinds and connects them by arrows in a defined order depicting a flow. There are twelve main Flowchart types: Basic Flowchart, Business Process Modeling Diagram (BPMN), Cross Functional Flowchart, Data Flow Diagram (DFD), IDEF (Integrated DEFinition) Flowchart, Event-driven Process Chain (EPC) Diagram, Influence Diagram (ID), Swimlane Flowchart, Process Flow Diagram (PFD), Specification and Description Language (SDL) Diagram, Value Stream Mapping, Workflow Diagram. Using the Flowcharts solution from the Diagrams area of ConceptDraw Solution Park you can easy and quickly design a Flowchart of any of these types. This solution offers a lot of special predesigned vector symbols for each of these widely used notations. They will make the drawing process of Flowcharts much easier than ever. Pay also attention for the included collection of ready Flowchart examples, samples and quick-start templates. This is business process improvement tools. If you are looking for MS Visio for your Mac, then you are out of luck, because it hasn't been released yet. However, you can use Visio alternatives that can successfully replace its functions. ConceptDraw DIAGRAM is an alternative to MS Visio for Mac that provides powerful features and intuitive user interface for the same.
Flowchart Programming Project. Flowchart Examples
Create you own flow charts of process-driven software applications using the ConceptDraw DIAGRAM diagramming and vector drawing software extended with the Cross-Functional Flowcharts solution from the Business Processes area of ConceptDraw Solution Park. The programming project flow chart example shows the logical process of execution.Definition Flowchart
A flowchart is a type of diagram that represents an algorithm, workflow or process, showing the steps as boxes of various kinds, and their order by connecting them with arrows. This definition flowchart gives a clear answer for the question "What is a flowchart?". It is convenient to use a powerful ConceptDraw DIAGRAM software extended with Flowcharts Solution from the "Diagrams" Area of ConceptDraw Solution Park to design flowcharts of various types which will additionally illustrate a definition flowchart.Flowchart design. Flowchart symbols, shapes, stencils and icons
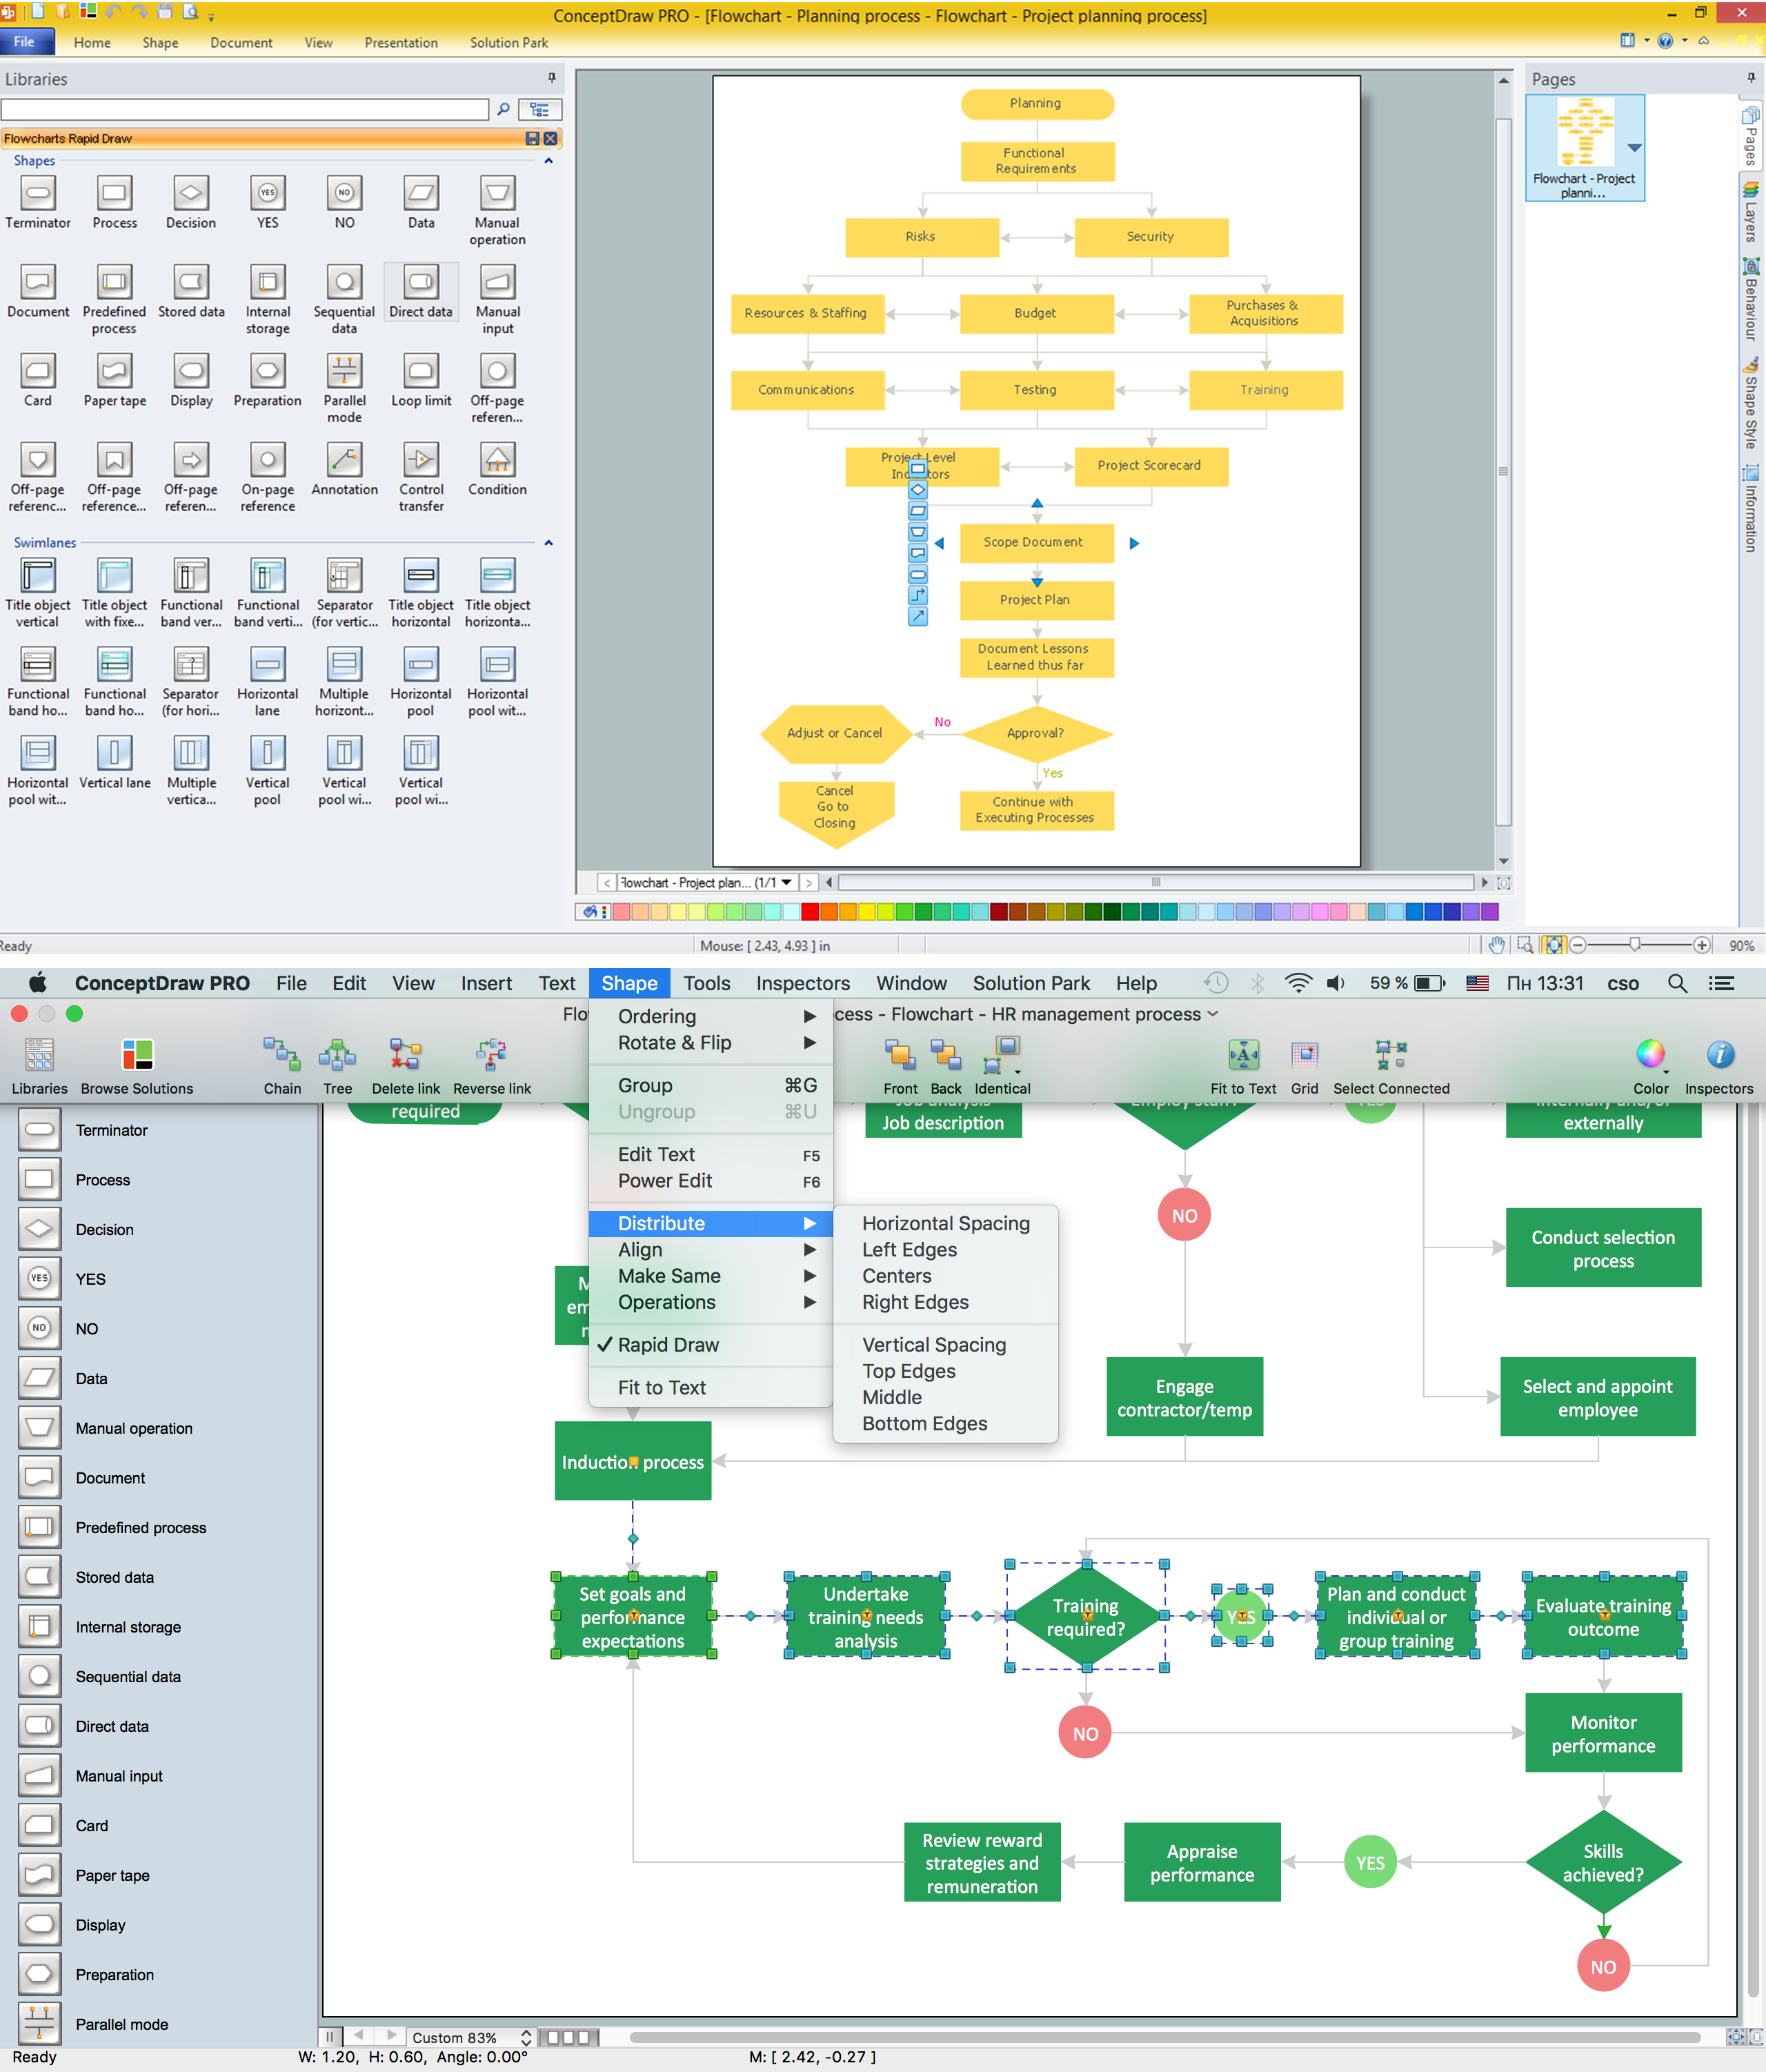
A flowchart is a type of diagram which represents an algorithm, process or workflow, displays the steps as boxes of various kinds and depicts their order by connecting them with arrows. Any business graphic document will be more colorful and understandable if will use professional-looking and visual diagrams and flowcharts. Flowchart design gives versatile presenting and explaining of the process. ConceptDraw DIAGRAM flowchart software enhanced with Flowcharts solution helps effectively make Flowchart Design. Use of predesigned flowchart symbols and bright color palette offers a fresh view and favorably distinguishes the flowcharts designed in ConceptDraw DIAGRAM from the black and white flowcharts on a paper. Preferably to use no more than three or four colors and apply identical for the same shape types. The best flowchart design can be achieved by starting with Flowchart template, or any of suitable ready examples or samples offered in ConceptDraw STORE, open one of them and enter the proper text into each Flowchart shape. Each symbol of the flowchart has a definition that can't be changed. This means that all flowcharts shapes can be grouped in according to their meaning. Users with ConceptDraw DIAGRAM flowchart software can style groups of symbols with close definitions by color sets chosen from complementary palette. Almost all workflows can be depicted as a flowchart. Colored diagrams are more light for perception of the certain information, this is part of flowchart design. Bright colors need to be used in the key points of Decision symbols, to focus attention on their importance for whole process flow.
Software for flowchart diagrams
Software for flowchart diagrams can help you: represents an algorithm or process, illustrates a solution to a given problem, represented process operations, analyzing a business process, designing a business process, documenting a business process, optimizing a business process. The Flowcharts Solution from the "Diagrams" area of ConceptDraw Solution Park contains a wide set of predesigned templates, samples and 3 libraries.Flowchart Software
The Flowcharts are popular and widely used for designing, documenting, managing and analyzing the complex processes and programs in various fields, such as science, business, engineering, architecture, manufacturing, administration, and many others. To design professional looking Flowchart Diagrams we recommend to use the ConceptDraw DIAGRAM diagramming and vector drawing software extended with set of Flowchart maker solutions from the Diagrams, Finance and Accounting, Marketing, and Business Processes areas of ConceptDraw Solution Park. ConceptDraw DIAGRAM flowchart software is rich for the libraries of ready-to-use predesigned vector flowchart objects, templates, samples and examples, which make it the best choice for designing the Flowcharts of any type and style. Besides, the ConceptDraw documents with Flowchart Diagrams are vector graphic documents, available for reviewing, modifying and converting to different popular formats: image, HTML, PDF file, MS PowerPoint Presentation, Adobe Flash or MS Visio XML.Example Process Flow
A flowchart is a picture of the separate steps of a process in sequential order. ConceptDraw DIAGRAM is a Process Flowcharts software. This software includes basic package of process flow examples. The software contains object libraries with vector stencils that allows you use RapidDraw technology. By clicking on direction arrows you can add a new object to the flowchart.Technical Flow Chart Example
What illustrates a technical flow chart? Technical flow chart is a diagrammatic representation which visually illustrates the sequence of operations that must to be performed to get the problem's solution. ConceptDraw DIAGRAM enhanced with Flowcharts Solution from the "Diagrams" Area of ConceptDraw Solution is a perfect software for drawing Technical Flow Chart Example illustrating the essence and importance of the technical flow chart use.Flowchart design. Flowchart symbols, shapes, stencils and icons
A flowchart is a type of diagram which represents an algorithm, process or workflow, displays the steps as boxes of various kinds and depicts their order by connecting them with arrows. Any business graphic document will be more colorful and understandable if will use professional-looking and visual diagrams and flowcharts. Flowchart design gives versatile presenting and explaining of the process. ConceptDraw DIAGRAM flowchart software enhanced with Flowcharts solution helps effectively make Flowchart Design. Use of predesigned flowchart symbols and bright color palette offers a fresh view and favorably distinguishes the flowcharts designed in ConceptDraw DIAGRAM from the black and white flowcharts on a paper. Preferably to use no more than three or four colors and apply identical for the same shape types. The best flowchart design can be achieved by starting with Flowchart template, or any of suitable ready examples or samples offered in ConceptDraw STORE, open one of them and enter the proper text into each Flowchart shape. Each symbol of the flowchart has a definition that can't be changed. This means that all flowcharts shapes can be grouped in according to their meaning. Users with ConceptDraw DIAGRAM flowchart software can style groups of symbols with close definitions by color sets chosen from complementary palette. Almost all workflows can be depicted as a flowchart. Colored diagrams are more light for perception of the certain information, this is part of flowchart design. Bright colors need to be used in the key points of Decision symbols, to focus attention on their importance for whole process flow.
Skype - eLearning Learning
eLearning with Skype without attending classes. Skype as a communication and instructional tool allows trainers to meet with students online and run training sessions. Solution which provides effective results.
 Business Process Workflow Diagrams
The Business Process Workflow Diagrams solution enhances the ConceptDraw DIAGRAM functionality with predesigned examples, samples and a numerous collection of predesigned vector objects of workflow chart elements, icons, arrows, connectors, and varied wor
Work Order Process Flowchart. Business Process Mapping Examples
The business process is a set of actions or tasks which are undertaken by an organization for production some goods or services, they are then offered for the customers and are ordered by them. Process Flowcharts and Order Process Flowcharts are sufficiently prevalent, well known and actively used in variety of fields of life, business and science. They are constructed using the common standardized symbols, thus are clear and understandable for all. They help effectively represent the processes, determine the order in which the process activities happen, document the order processes, and also effectively analyze the processes with a goal to increase their efficiency. Create your own Process Flowcharts, Order Process Flowcharts, Cross-Functional Flow Charts representing the order processing steps using powerful drawing tools of ConceptDraw DIAGRAM software and variety of predesigned vector objects from the libraries of Business Process Mapping Solution from Business Processes area of ConceptDraw Solution Park.Gane Sarson Diagram
The Gane-Sarson methodology uses the graphical techniques for building the logical models for the systems. It is helpful for analysts and designers to make common and clear picture of the system, to depict all its processes and how they transform the data. The Gane-Sarson methodology lets represent all this information in a way understandable for the users and other interested people, and gives the possibility to see instantly how the system's parts serve together to meet their needs. This methodology supposes the building of a system top-down. First you need create an overall system data flow, then determine the details of the data structures, the process logic and design the modular structures. ConceptDraw DIAGRAM diagramming and vector drawing software offers the Data Flow Diagrams solution with Gane-Sarson Notation library rich for the specific symbols of the Gane-Sarson notation. All they are vector and fully ready-to-use for drawing the Data Flow Diagrams, which will be then successfully used in presentations, websites, and various business documents.Flow Chart Creator
It is impossible to imagine the managing and analyzing of business and technical processes without flowcharts. They are the best way to visually represent the structural data, algorithms, the steps of the process, they allow to illustrate the process flow direction and solution to a given problem. ConceptDraw DIAGRAM diagramming and vector drawing software extended with flowchart maker and Flowcharts Solution from the "Diagrams" Area is a powerful Flow Chart Creator.Flowcharting Software
A flowchart is a useful type of diagram quite popular in many areas of science and business, which represents some algorithm, workflow or process. ConceptDraw DIAGRAM diagramming and vector graphic software extended with Flowcharts solution from the "Diagrams" area of ConceptDraw Solution Park is also ideal flowcharting software with powerful tools that assist in easily making the Flowcharts of different types and directions, in representing the flowchart steps and describing the flowchart processes, in realizing the flowchart constructions, creating the process flow models, designing the data flow diagrams, and many other flowcharting related diagrams. ConceptDraw DIAGRAM software maximally facilitates the drawing process by means of included predesigned vector objects, which only need to be dragged to your ConceptDraw document from the corresponding library and connected with smart connectors. This way lets equally easy make the simple flowcharts, as well as flowcharts of complex processes and procedures.Histogram Chart
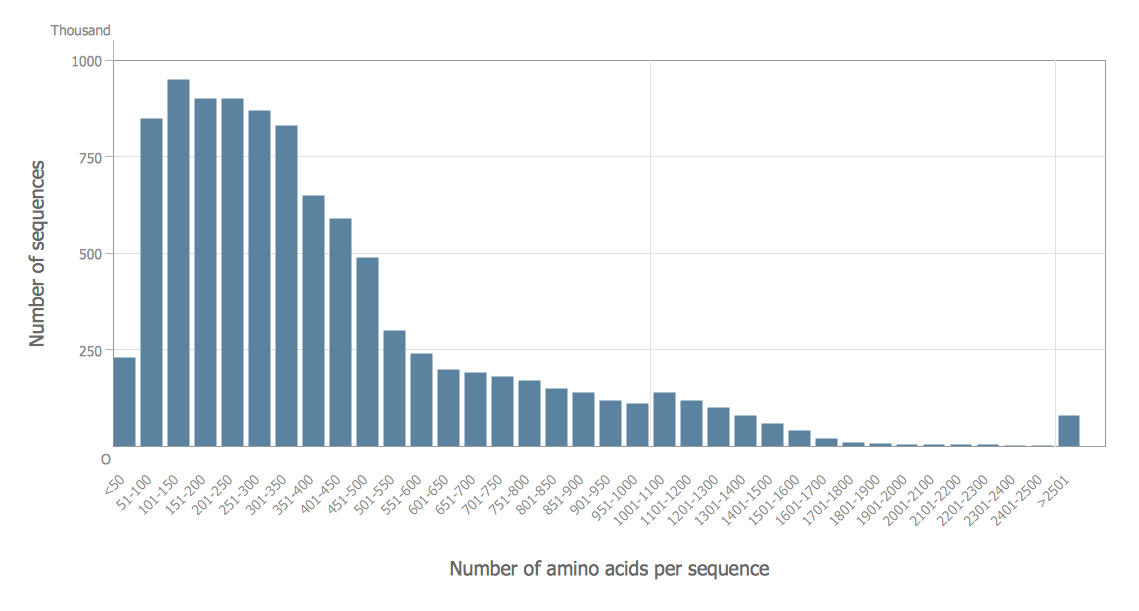
What is a Histogram Chart? It is a chart which visually displays a distribution of the data. ConceptDraw DIAGRAM extended with Histograms solution from the Graphs and Charts area of ConceptDraw Solution Park is the best software for fast and simple drawing professional looking Histogram Chart.Venn Diagram Examples for Problem Solving. Computer Science. Chomsky Hierarchy
A Venn diagram, sometimes referred to as a set diagram, is a diagramming style used to show all the possible logical relations between a finite amount of sets. In mathematical terms, a set is a collection of distinct objects gathered together into a group, which can then itself be termed as a single object. Venn diagrams represent these objects on a page as circles or ellipses, and their placement in relation to each other describes the relationships between them. The Venn diagram example below visualizes the the class of language inclusions described by the Chomsky hierarchy.Use a Fishbone Diagram to Attack Complex Problems
Any project is a complex system which rarely goes without some problems, even the most minor. But the success of the project mostly depends from the ability effectively solve appearing problems. There are many methods for problem solving, one of the most effective is the use a Fishbone diagram to attack complex problems. Use ConceptDraw DIAGRAM diagramming software with Fishbone Diagrams Solution to attack any complex problems with fishbone diagrams graphic method. Construct Fishbone diagram to help users brainstorm and break down a complex problem.Successful Strategic Plan
This sample shows the Strategic Plan of the Broadband Lifecycle that was developed by Strategic Networks Group. The Broadband Lifecycle represents the advance of the broadband investments.Create Flow Chart on Mac
A Flowchart is a commonly used type of chart that describes an algorithm, process or workflow. It applies the boxes of various kinds to represent the steps and connects them with arrows showing their order. The Flowcharts help to understand the processes, visualize the process steps, and effectively find the flaws and bottlenecks. They are widely used in various fields for analyzing, documenting, designing, and managing simple and complex processes and programs, for representing process operations and problems' solution models. There are many types of Flowcharts, such as Cross-Functional Flowcharts, Data Flow Diagrams, Swimlane Flowcharts, Workflow Diagrams, Business Process Diagrams, Process Flowcharts, etc. ConceptDraw DIAGRAM is a powerful diagram software used to create Flow chart on Mac and Windows without efforts. The Flowcharts solution from Diagrams area of ConceptDraw Solution Park and ConceptDraw Rapid Draw functionality are greatly effective tools for designing various types of Flowcharts for business processes.- Definition Flowchart | Types of Flowcharts | Flowchart design ...
- Simple Flow Chart | Process Flowchart | Bar Diagrams for Problem ...
- The Diagrammatic Representation That Illustrate The Steps For The ...
- Workflow Diagram Template | Scrum workflow | Workflow Diagram ...
- Food security assessment - Flowchart | Flowcharts | Contoh ...
- Software for flowchart diagrams | Flowchart design. Flowchart ...
- Activities In A Project Management Software With Example Diagram
- Technical Flow Chart
- Diagram Flow Chart | Flowchart Definition | Types of Flowcharts ...
- How to Send an Outlook Email From a Mind Map | Software for ...
- How to Add a Cross-Functional Flowchart to MS Word | How to Add ...
- Venn Diagram Examples for Problem Solving. Environmental Social ...
- Problem Solution Map Examples
- CAD Drawing Software for Making Mechanic Diagram and Electrical ...
- Competitor Analysis | Cloud Computing Architecture Diagrams ...
- Process Flowchart | Software for flowchart diagrams | | Flowchart ...
- Simple Flow Chart | Flowchart Definition | Process Flow Chart ...
- Simple & Fast Diagram Software | Process Flow Chart Software Free ...
- Flow chart Example. Warehouse Flowchart | Material Requisition ...
- Software Diagram Examples and Templates | Network Diagram ...


