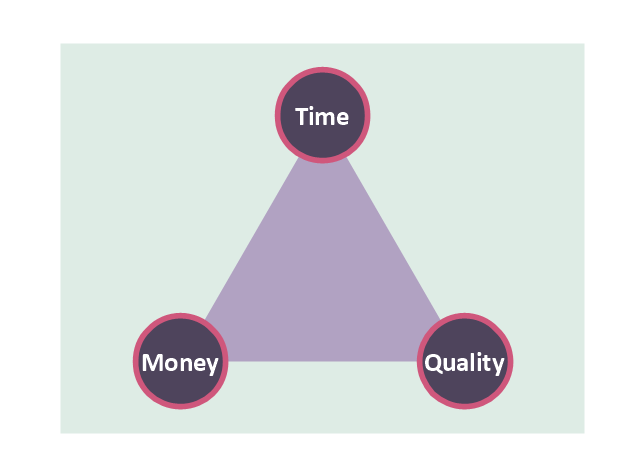
"The Time/ Money/ Quality Triangle illustrates an advertising truism, that "you can't have all three." If there is little time or money, then ad quality will suffer. The more time and/ or money that is available to the project, the higher the quality can be. However, the level of quality must be appropriate to the product...not all products should have high-quality ads!" [Advertising/ Strategies. Wikibooks]
This triangular diagram example was redesigned using the ConceptDraw PRO diagramming and vector drawing software from Wikimedia Commons file Time-Quality-Money.png. [commons.wikimedia.org/ wiki/ File:Time-Quality-Money.png]
This file is licensed under the Creative Commons Attribution-Share Alike 3.0 Unported license. [creativecommons.org/ licenses/ by-sa/ 3.0/ deed.en]
The chart sample "Time, quality, money triangle diagram" is included in the Pyramid Diagrams solution from the Marketing area of ConceptDraw Solution Park.
 Fishbone Diagram
Fishbone Diagrams solution extends ConceptDraw PRO software with templates, samples and library of vector stencils for drawing the Ishikawa diagrams for cause and effect analysis.
 Pie Charts
Pie Charts are extensively used in statistics and business for explaining data and work results, in mass media for comparison (i.e. to visualize the percentage for the parts of one total), and in many other fields. The Pie Charts solution for ConceptDraw PRO v10 offers powerful drawing tools, varied templates, samples, and a library of vector stencils for simple construction and design of Pie Charts, Donut Chart, and Pie Graph Worksheets.
- Quality Png Vector
- Pyramid Diagram | Time, quality , money triangle diagram | Currency ...
- Pyramid Diagram | Time, quality , money triangle diagram | Pyramid ...
- Quality System Management Png
- Quality Clipart Png
- Pyramid Diagram | Time, quality , money triangle diagram | Time ...
- Pyramid Diagram | Time, quality , money triangle diagram | Time ...
- Pyramid Diagram | Time, quality , money triangle diagram | Australia ...
- Pyramid Diagram | Time, quality , money triangle diagram | Money ...
- Business Productivity - Marketing | Helpful in all stages of quality ...
- Ring Network Topology | Organizational Structure Total Quality ...
- Business feedback loop | Helpful in all stages of quality ...
- Pyramid Diagram | Time, quality , money triangle diagram | Vicious ...
- Pyramid Diagram | Time - Vector stencils library | Time, quality ...
- Wireless Network Mode | Seven Basic Tools of Quality ...
- ADS Png
- Quality Png
- Pyramid Diagram | Decision Making | Helpful in all stages of quality ...
- Tqm Png
- High Quality Map Of Africa Png
