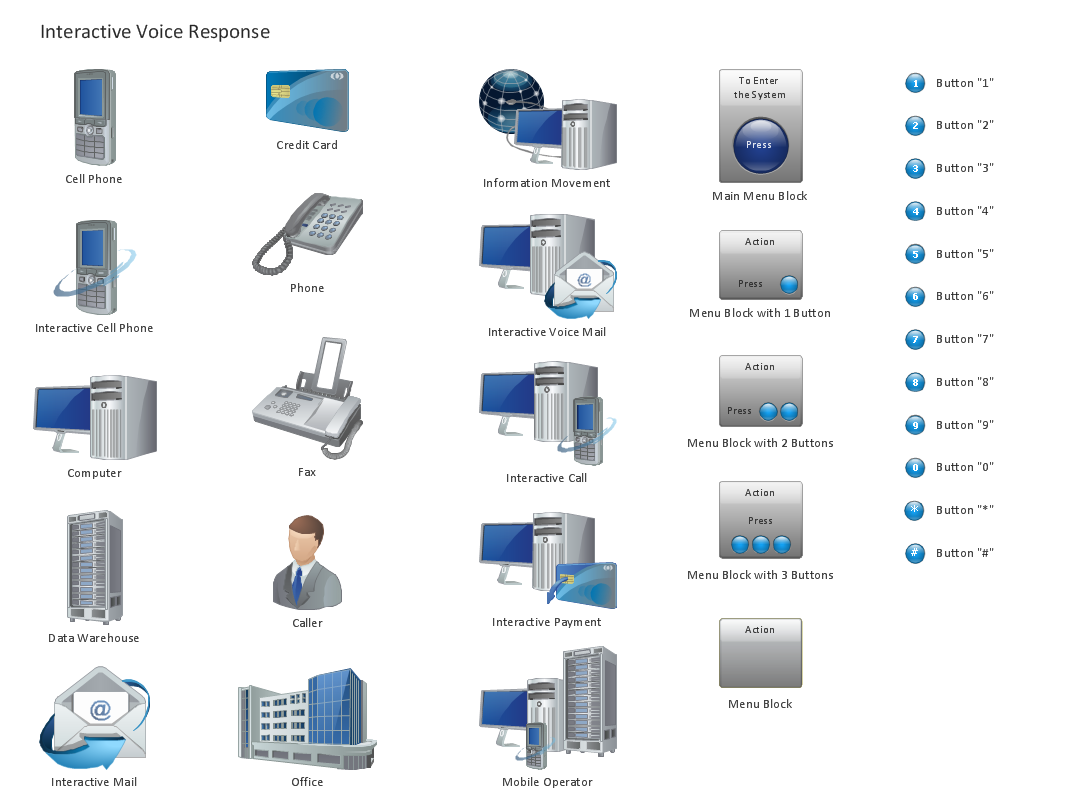
 Interactive Voice Response Diagrams
Interactive Voice Response Diagrams solution extends ConceptDraw PRO v10 with samples, templates and library of ready-to-use vector stencils to help create Interactive Voice Response (IVR) diagrams illustrating a work of interactive voice response system, Voice-over-Internet Protocol (VoIP) diagrams and Action VoIP diagrams with representing voice actors on them.
 Electric and Telecom Plans
This solution extends ConceptDraw PRO software with samples, templates and libraries of vector stencils for drawing the Electric and Telecom Plans.
Design Element: IVR for Network Diagrams
ConceptDraw PRO is perfect for software designers and software developers who need to draw IVR Network Diagrams.
 Computer Network Diagrams
Computer Network Diagrams solution extends ConceptDraw PRO software with samples, templates and libraries of vector stencils for drawing the computer network topology diagrams.
 Social Media Response
This solution extends ConceptDraw PRO and ConceptDraw MINDMAP with the ability to draw interactive flow charts with action mind map templates, to help create an effective response to applicable social media mentions.
 Basic Pie Charts
This solution extends the capabilities of ConceptDraw PRO v10.3.0 (or later) with templates, samples, and a library of vector stencils for drawing pie and donut charts.
 ConceptDraw Solution Park
ConceptDraw Solution Park collects graphic extensions, examples and learning materials
 Area Charts
Area Charts are used to display the cumulative totals over time using numbers or percentages; or to show trends over time among related attributes. The Area Chart is effective when comparing two or more quantities. Each series of data is typically represented with a different color, the use of color transparency in an object’s transparency shows overlapped areas and smaller areas hidden behind larger areas.
 Logistics Flow Charts
Logistics Flow Charts solution extends ConceptDraw PRO v11 functionality with opportunities of powerful logistics management software. It provides large collection of predesigned vector logistic symbols, pictograms, objects and clipart to help you design with pleasure Logistics flow chart, Logistics process flow diagram, Inventory flow chart, Warehouse flowchart, Warehouse management flow chart, Inventory control flowchart, or any other Logistics diagram. Use this solution for logistics planning, to reflect logistics activities and processes of an enterprise or firm, to depict the company's supply chains, to demonstrate the ways of enhancing the economic stability on the market, to realize logistics reforms and effective products' promotion.
 Organizational Charts
Organizational Charts solution extends ConceptDraw PRO software with samples, templates and library of vector stencils for drawing the org charts.
 Basic Area Charts
This solution extends the capabilities of ConceptDraw PRO v10.3.0 (or later) with templates, samples and a library of vector stencils for drawing Area Charts (area graphs) that visualize changes in values by filling in the area beneath the line connecting data points.
 Divided Bar Diagrams
The Divided Bar Diagrams Solution extends the capabilities of ConceptDraw PRO v10 with templates, samples, and a library of vector stencils for drawing high impact and professional Divided Bar Diagrams and Graphs, Bar Diagram Math, and Stacked Graph.
 Audit Flowcharts
Audit flowcharts solution extends ConceptDraw PRO software with templates, samples and library of vector stencils for drawing the audit and fiscal flow charts.
 Pie Charts
Pie Charts are extensively used in statistics and business for explaining data and work results, in mass media for comparison (i.e. to visualize the percentage for the parts of one total), and in many other fields. The Pie Charts solution for ConceptDraw PRO v10 offers powerful drawing tools, varied templates, samples, and a library of vector stencils for simple construction and design of Pie Charts, Donut Chart, and Pie Graph Worksheets.
 Germany Map
The Germany Map solution contains collection of samples, templates and scalable vector stencil graphic maps, representing map of Germany and all 16 states of Germany. Use the Germany Map solution from ConceptDraw Solution Park as the base for various them
- Top 5 Android Flow Chart Apps | Interactive Voice Response ...
- Ivr Flow Diagram For Telephone
- Basic Flowchart Symbols and Meaning | Interactive Voice Response ...
- Cycle of automobile dependency - Circle pie chart | Process ...
- Interactive Voice Response Diagrams | Telecommunication Network ...
- Interactive Voice Response Diagrams | Communication Diagram ...
- Interactive Voice Response Diagrams | UML Collaboration Diagram ...
- How to Create an Interactive Voice Response ( IVR ) Diagram in ...
- IVR | IVR mobile operator diagram | PM Response | Diagram Of ...
- Rapid UML | Electric and Telecom Plans | Electrical Engineering ...
- Interactive Voice Response Diagrams | UML for Bank | UML ...
- How to Create an Interactive Voice Response ( IVR ) Diagram in
- Telecommunication Network Diagrams | Fault Tree Analysis ...
- How To use House Electrical Plan Software | Interactive Voice ...
- SWOT and TOWS Matrix Diagrams | Interactive Voice Response ...
- Entity-Relationship Diagram (ERD) | Process Flowchart | Interactive ...
- Interactive Voice Response Network Diagram | Design Element: IVR ...
- Telephone Company Flow Chart
- Interactive voice response ( IVR ) - Vector stencils library | Interactive ...
- Interactive Voice Response Network Diagram | Network Diagram ...
