Timeline Examples

Project Timeline

How to Make a Timeline

 Timeline Diagrams
Timeline Diagrams solution extends ConceptDraw DIAGRAM diagramming software with samples, templates and libraries of specially developed smart vector design elements of timeline bars, time intervals, milestones, events, today marker, legend, and many other elements with custom properties, helpful for professional drawing clear and intuitive Timeline Diagrams. Use it to design simple Timeline Diagrams and designate only the main project stages, or highly detailed Timeline Diagrams depicting all project tasks, subtasks, milestones, deadlines, responsible persons and other description information, ideal for applying in presentations, reports, education materials, and other documentation.
Swim Lanes Flowchart. Flowchart Examples


Infographic Generator
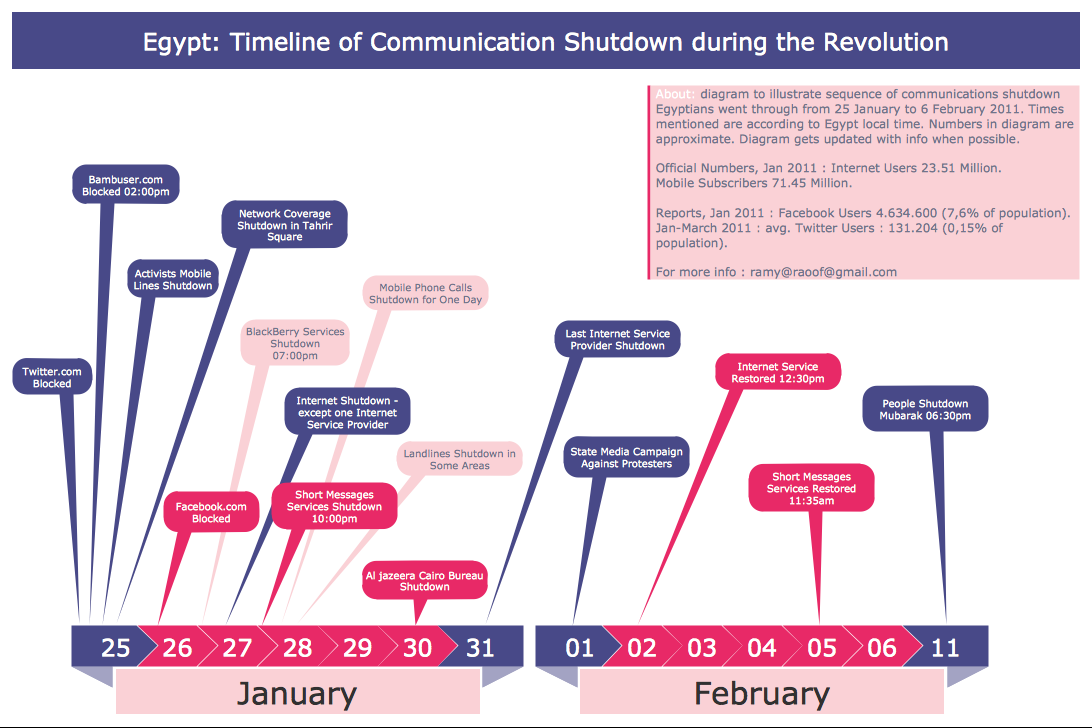
Timeline charts presents events and time periods on a chronological scale. They are used in project management to visualize project milestones and upper level phases, and show project progress.
"Within the framework of project management, a milestone is an event that receives special attention. It is often put at the end of a stage to mark the completion of a work package or phase. Milestones can be put before the end of a phase so that corrective actions can be taken, if problems arise, and the deliverable can be completed on time.
In addition to signaling the completion of a key deliverable, a milestone may also signify an important decision or the derivation of a critical piece of information, which outlines or affects the future of a project. In this sense, a milestone not only signifies distance traveled (key stages in a project) but also indicates direction of travel since key decisions made at milestones may alter the route through the project plan." [Milestone (project management). Wikipedia]
This timeline diagram example was created using the ConceptDraw PRO diagramming and vector drawing software extended with the Timeline Diagrams solution from the Management area of ConceptDraw Solution Park.
Timeline

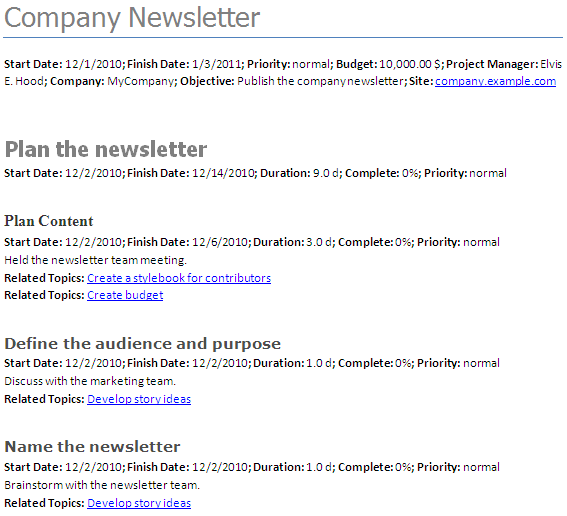
Project Outline
 PM Presentations
The PM Presentations solution extends the power of ConceptDraw MINDMAP , ConceptDraw DIAGRAM , and ConceptDraw PROJECT, improving their efficiency at many stages of the project management process by using the same source data to construct the targeted presentation for your audience and clearly communicating the appropriate information to different audiences from a single source. It gives an ability to project managers and other team participants to create and to deliver capacious presentations representing the data and knowledge of a specific project with the help of including visual dashboards, Gantt charts, resource views, maps, timelines, calendars, illustrations, project diagrams and reports of varied types. Having the possibility to edit collaboratively in a Full-Screen Mode, the teams can rapidly plan a project as well as execute the tasks of revising and making changes to it.
- Project Timeline | Timeline Examples | Timeline Diagrams ...
- How to Identify Project Milestones | How to Report on Project ...
- Timeline Examples | Project Timeline | How to Make a Timeline ...
- How to Make a Timeline | Timeline Diagrams | Project Timeline ...
- Project Plan Timeline Example
- Pertt Chart With Milestones Example
- Timeline Examples | Project Timeline | Timeline Diagrams | Visio ...
- Project plan timeline - Request for proposal (RFP) | Activity Network ...
- Project Timeline | Timeline Examples | How to Make a Timeline ...