This site uses cookies. By continuing to browse the ConceptDraw site you are agreeing to our Use of Site Cookies.

Pyramid Diagram

Triangle diagram example of DIKW pyramid has 4 levels: data, information, knowledge and wisdom.

Export from ConceptDraw PRO Document to a Graphic File

Now it’s easy to share your visual documents with other people in a form most convenient for them. ConceptDraw PRO can save your drawings and diagrams in a number of highly useful formats, including graphic files. You can save your drawing as a .PNG, .JPG, or other graphic format file.
Export to a Graphic File
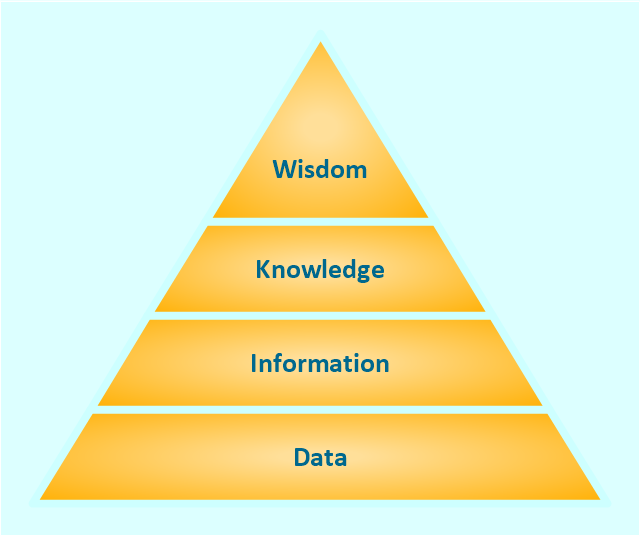
"The DIKW Pyramid, also known variously as the "DIKW Hierarchy", "Wisdom Hierarchy", the "Knowledge Hierarchy", the "Information Hierarchy", and the "Knowledge Pyramid", refers loosely to a class of models for representing purported structural and/ or functional relationships between data, information, knowledge, and wisdom. "Typically information is defined in terms of data, knowledge in terms of information, and wisdom in terms of knowledge"."
[DIKW Pyramid. Wikipedia]
This triangle diagram example of DIKW pyramid has 4 levels: data, information, knowledge and wisdom.
It redesigned using the ConceptDraw PRO diagramming and vector drawing software from Wikimedia Commons file DIKW-diagram.png. [commons.wikimedia.org/ wiki/ File:DIKW-diagram.png]
This file is licensed under the Creative Commons Attribution-Share Alike 3.0 Unported license. [creativecommons.org/ licenses/ by-sa/ 3.0/ deed.en]
The trianglular chart sample "Knowledge hierarchy triangle diagram" is included in the Pyramid Diagrams solution from the Marketing area of ConceptDraw Solution Park.
Pyramid diagram
Pyramid diagram, pyramid, triangle,
The vector stencils library "Management pictograms" contains 72 management pictograms.
Use it to create your management infogram in the ConceptDraw PRO diagramming and vector drawing software.
The flat icons example "Management pictograms - Vector stencils library" is included in the solution "Marketing infographics" from the "Business infographics" area of ConceptDraw Solution Park.
Accounting management
Accounting management, accounting management,
Activity
Activity, activity,
Audit management
Audit management, audit management,
Board of directors
Board of directors, board of directors,
Budget
Budget, budget,
Business managemen
Business managemen, business managemen,
Business management tools
Business management tools, business management tools,
Business model
Business model, business model,
Commanding
Commanding, commanding,
Communication
Communication, communication,
Company
Company, company,
Contract management
Contract management, contract management,
Controlling
Controlling, controlling,
Coordinating
Coordinating, coordinating,
Core competencies
Core competencies, core competencies,
Corporate strategy
Corporate strategy, corporate strategy,
Creativity
Creativity, creativity,
Crisis management
Crisis management, crisis management,
Crisis management 2
Crisis management 2, crisis management,
Decision making
Decision making, decision making,
Environmental management
Environmental management, environmental management,
Expenses
Expenses, expenses,
External environment
External environment, external environment,
Financial management
Financial management, financial management,
Financial management 2
Financial management 2, financial management,
Financial planning
Financial planning, financial planning,
First-level manager
First-level manager, first-level manager,
Goal
Goal, goal,
HR management
HR management, HR management,
Investment management
Investment management, investment management,
IT management
IT management, IT management,
Knowledge management
Knowledge management, knowledge management,
Knowledge management 2
Knowledge management 2, knowledge management,
Leadership
Leadership, leadership,
Macro environment
Macro environment, macro environment,
Management system
Management system, management system,
Managerial accounting
Managerial accounting, managerial accounting,
Manufacturing management
Manufacturing management, manufacturing management,
Market orientation
Market orientation, market orientation,
Marketing management
Marketing management, marketing management,
Marketing strategy
Marketing strategy, marketing strategy,
Middle-level manager
Middle-level manager, middle-level manager,
Mission
Mission, mission,
Objectives
Objectives, objectives,
Operations management
Operations management, operations management,
Organizing
Organizing, organizing,
Performance
Performance, performance,
Performance management
Performance management, performance management,
Planning
Planning, planning,
Policy
Policy, policy,
PR management
PR management, PR management,
Problem solving
Problem solving, problem solving,
Process management
Process management, process management,
Product management
Product management, product management,
Profit
Profit, profit,
Profit 2
Profit 2, profit,
Project management
Project management, project management,
Quality management
Quality management, quality management,
Research and development
Research and development, research and development,
Resource management
Resource management, resource management,
Resources
Resources, resources,
Risk management
Risk management, risk management,
Sales manegment
Sales manegment, sales manegment,
Service management
Service management, service management,
Stakeholder management
Stakeholder management, stakeholder management,
Strategic management
Strategic management, strategic management,
Strategic planning
Strategic planning, strategic planning,
Technology management
Technology management, technology management,
Time frame
Time frame, time frame,
Time management
Time management, time management,
Top-level manager
Top-level manager , top-level manager ,
Vision
Vision, vision,
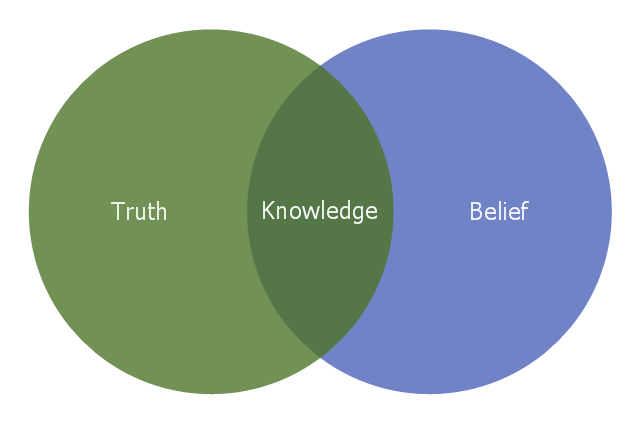
This Venn diagram sample illustrates the Plato's definition of knowledge. It was designed on the base of the Wikimedia Commons file: Belief Venn diagram.svg. [commons.wikimedia.org/ wiki/ File:Belief_ Venn_ diagram.svg]
"Justified true belief is a definition of knowledge that is most frequently credited to Plato and his dialogues. The concept of justified true belief states that in order to know that a given proposition is true, one must not only believe the relevant true proposition, but one must also have justification for doing so. In more formal terms, a subject S knows that a proposition P is true if and only if:
(1) P is true,
(2) S believes that P is true, and
(3) S is justified in believing that P is true" [Justified true belief. Wikipedia]
The Venn diagram example "Knowledge" was created using the ConceptDraw PRO diagramming and vector drawing software extended with the Venn Diagrams solution from the area "What is a Diagram" of ConceptDraw Solution Park.
Venn diagram
Venn diagram, Venn diagram,

Process Flowchart

The main reason of using Process Flowchart or PFD is to show relations between major parts of the system. Process Flowcharts are used in process engineering and chemical industry where there is a requirement of depicting relationships between major components only and not include minor parts. Process Flowcharts for single unit or multiple units differ in their structure and implementation. ConceptDraw PRO is Professional business process mapping software for making Process flowcharts, Process flow diagram, Workflow diagram, flowcharts and technical illustrations for business documents and also comprehensive visio for mac application. Easier define and document basic work and data flows, financial, production and quality management processes to increase efficiency of your business with ConcepDraw PRO. Business process mapping software with Flowchart Maker ConceptDraw PRO includes extensive drawing tools, rich examples and templates, process flowchart symbols and shape libraries, smart connectors that allow you create the flowcharts of complex processes, process flow diagrams, procedures and information exchange. Process Flowchart Solution is project management workflow tools which is part ConceptDraw Project marketing project management software. Drawing charts, diagrams, and network layouts has long been the monopoly of Microsoft Visio, making Mac users to struggle when needing such visio alternative like visio for mac, it requires only to view features, make a minor edit to, or print a diagram or chart. Thankfully to MS Visio alternative like ConceptDraw PRO software, this is cross-platform charting and business process management tool, now visio alternative for making sort of visio diagram is not a problem anymore however many people still name it business process visio tools.
How To Create a Process Flow Chart (business process modelling techniques)

Pyramid Chart Examples

Pyramid Charts and Triangle Diagrams are used to visually structure the topics and progressively order the quantitative data. They allow to illustrate hierarchical structure of the topics, proportional, interconnected and containment relations among the topics. The multilevel Pyramids and Triangle diagrams are constructed oriented up or down and divided into several horizontal slices. They are effectively used to represent marketing strategies, social strategies, information systems, market value, etc., to illustrate presentations, websites, documents, reports in business, finances, sales, management, marketing, media, training, consulting, and many other fields. To maximize the efficiency in drawing the Pyramid Charts, use the ConceptDraw PRO diagramming and vector drawing software extended with Pyramid Diagrams solution from Marketing area, which contains the set of Pyramid Chart examples, samples, templates and vector design elements of triangular diagrams and pyramids with different quantity of levels for various needs.

Pyramid Diagram

A five level pyramid model of different types of Information Systems based on the information processing requirement of different levels in the organization. five level pyramid example is included in the Pyramid Diagrams solution from Marketing area of ConceptDraw Solution Park.

Pyramid Diagram

The DIKW Pyramid refers loosely to a class of models for representing purported structural and/or functional relationships between data, information, knowledge, and wisdom.

Pyramid Diagram

The representation of data in a hierarchical or pyramid-like form is one of the most effective and illustrative ways of structuring the data, information, ideas in different fields, among them marketing, management, business, finances, sales, consulting, media, and some others. Pyramid Diagram perfectly suits for this goal, especially if we talk about the representing some marketing strategies, information systems, social strategies. Pyramid Diagram looks like a triangle or reversed triangle that is divided visually on several layers. Each layer can be colored with its own color, this lets visually highlight important moments. ConceptDraw PRO diagramming and vector graphics software extended with Pyramid Diagrams solution from the Marketing area provides powerful drawing tools, templates, samples, and built-in vector pyramid objects, thus all required tools for equally easy drawing Three level pyramid diagram, Four level pyramid model, Five level pyramid, etc., at this your Pyramid diagrams can have 2D or 3D view as you like.

Typography Infographic Examples

ConceptDraw PRO extended with Typography Infographics Solution from the “Infographics” Area is a powerful infographic software that offers you variety of infographics examples. Use of predesigned examples as the base for your own Typography Infographics is a timesaving and useful way. Simply open the desired example, change for your needs and then successfully use it in any field of your activity.

Pyramid Diagram

Pyramid diagrams help you visualize information as a triangle divided into horizontal slices. Labelled slices represent a hierarchy. Pyramids are used in marketing presentations to show and analyze hierarchy levels. 3D triangular diagram of DIKW pyramid has 6 levels: measurement, facts, data, information, knowledge, wisdom. The data component include different scattered signs or symbols which are merely useless until these random objective facts are somehow processed. Data is a resource which has to be manipulated or rearranged to get useful. Information can be extracted from a pile of data, it also can be mined from different data storages.

Transportation Infographics

ConceptDraw is a visualization Software for making transportation infographics. Infographics design vector elements and vector graphics which will surely help you in your design process.