Reporting & Data Visualization
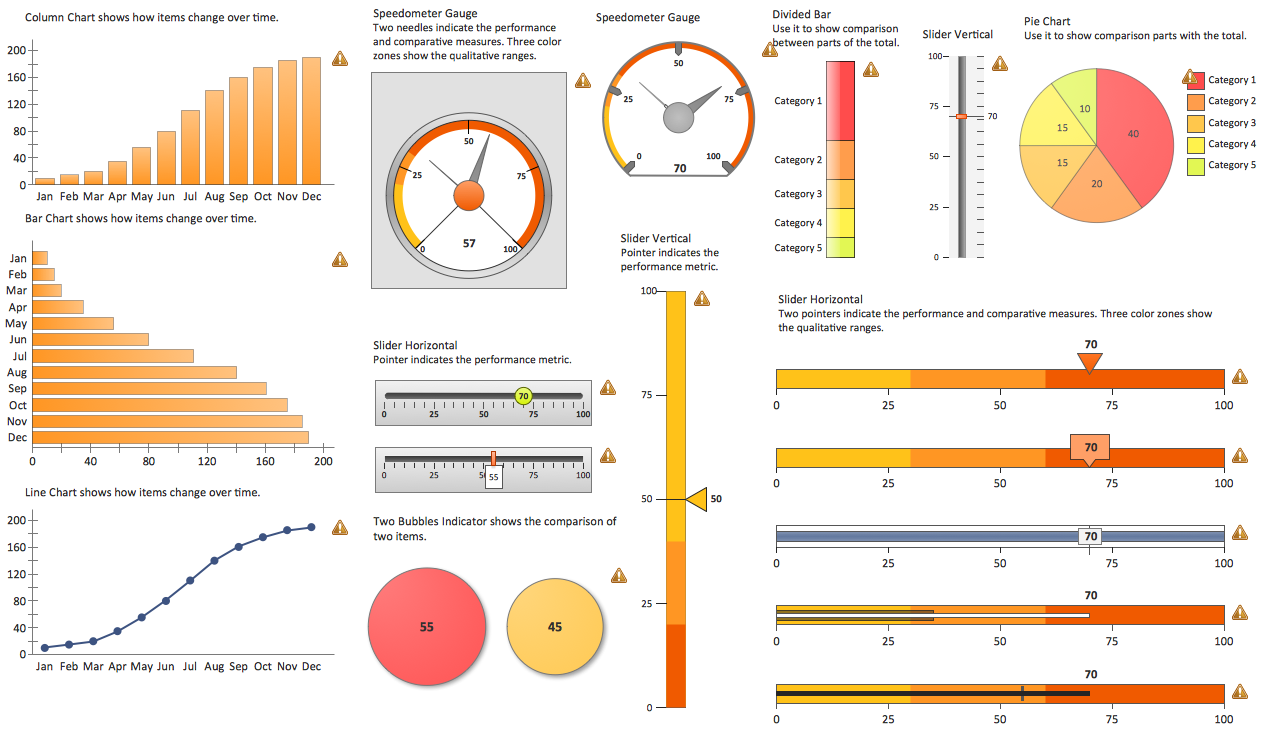
Using professional reporting and data visualization is the way your business can improve. ConceptDraw Sales Dashboard solution allows you produce live dashboards show KPI to monitor you sales activity and results in real time.
 Logistic Dashboard
The powerful tools of Logistic Dashboard solution and specially developed live graphic objects of logistic icons, logistic navigation elements, logistic indicators, logistic charts and logistic maps effectively assist in designing Logistic dashboards, Logistic maps, Logistic charts, diagrams and infographics. The included set of prebuilt samples and quick-start templates, demonstrates the power of ConceptDraw PRO software in logistics management, its assisting abilities in development, realization and analyzing the logistic processes, as well as in perfection the methods of logistics management.
 Seven Management and Planning Tools
Seven Management and Planning Tools solution extends ConceptDraw PRO and ConceptDraw MINDMAP with features, templates, samples and libraries of vector stencils for drawing management mind maps and diagrams.
Balanced Scorecard Software
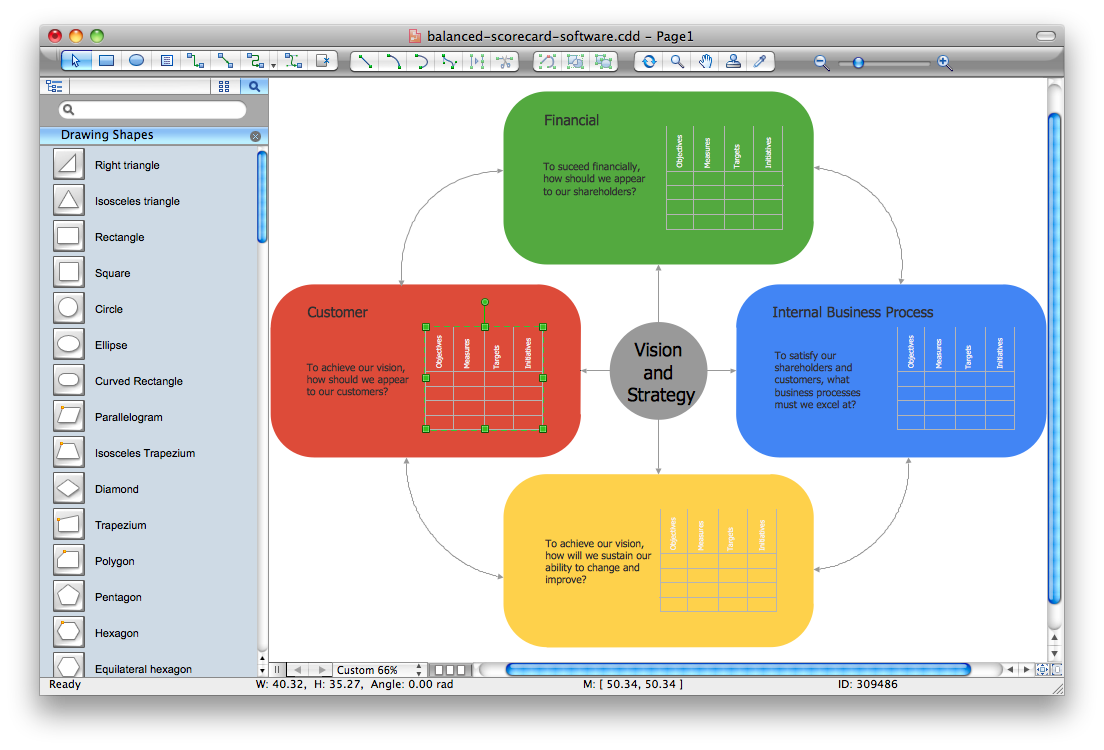
Balanced Scorecard Software provide incredible large variety of samples, templates and libraries of predesigned vector objects. Nothing could be easy that use the predesigned template and fill it, and simply drag the ready-to-use objects for designing your own balanced scorecard diagram.
 Stakeholder Onion Diagrams
The Stakeholder Onion Diagram is often used as a way to view the relationships of stakeholders to a project goal. A basic Onion Diagram contains a rich information. It shows significance of stakeholders that will have has influence to the success achieve
ConceptDraw PRO 9 Comparison with Omnigraffle Professional and MS Visio
ConceptDraw PRO comparison with Omnigraffle Professional and MS Visio shows you the significant benefits of ConceptDraw PRO, which offers varied useful drawing tools, the capability of creation multi-page documents, wide export / import capabilities in graphic formats, integration with Visio and Microsoft Office applications, availability of built-in scripting language and ConceptDraw Solution Park with numerous solutions, vector objects libraries, templates and samples. Business today is conducted with incredible rate and dynamic presentations become very popular. Sometimes while conducting the business, may happen that you can't describe some situation, state, or process with only words. In these cases it is convenient to include graphics and diagrams associated with the text. This guarantees successful communication with other stakeholders and team members, and faultless understanding the information by them. The combination of words and graphics is ideal combination, it improves the clarity and removes any doubt. ConceptDraw PRO helps you easy create any kinds of diagrams and dynamic presentations too.- Financial Comparison Chart | Design elements - Sales KPIs and ...
- Sales Turnover Graph Samples
- Bar Chart Kpi
- How to Draw a Line Chart Quickly | Temperature Kpis
- Enterprise dashboard | KPI Dashboard | HR Flowcharts | Human ...
- Performance Indicators | PM Dashboards | Design elements - Sales ...
- Product Kpi Graph
- Performance Indicators | What is a KPI ? | KPI Dashboard | Key ...
- Enterprise dashboard | KPI Dashboard | Business Intelligence ...
- Business Report Pie. Pie Chart Examples | Performance Indicators ...
- Design elements - Sales KPIs and metrics | Bar Diagrams for ...
- KPIs and Metrics | Business Intelligence Dashboard | Competitor ...
- Sales geographically - Performance dashboard | Performance ...
- Financial Comparison Chart | Purchasing Flow Chart . Purchasing ...
- Financial Comparison Chart | Percentage Pie Chart . Pie Chart ...
- Sales Dashboards for Your Company | Sales Growth. Bar Graphs ...
- Website KPIs - Visual dashboard | A KPI Dashboard | Sales KPIs ...
- KPI Dashboard | Enterprise dashboard | Business Graphics ...
- Recruitment Kpi Examples
- Sales Growth. Bar Graphs Example | Sales Dashboard | Line Graph ...


