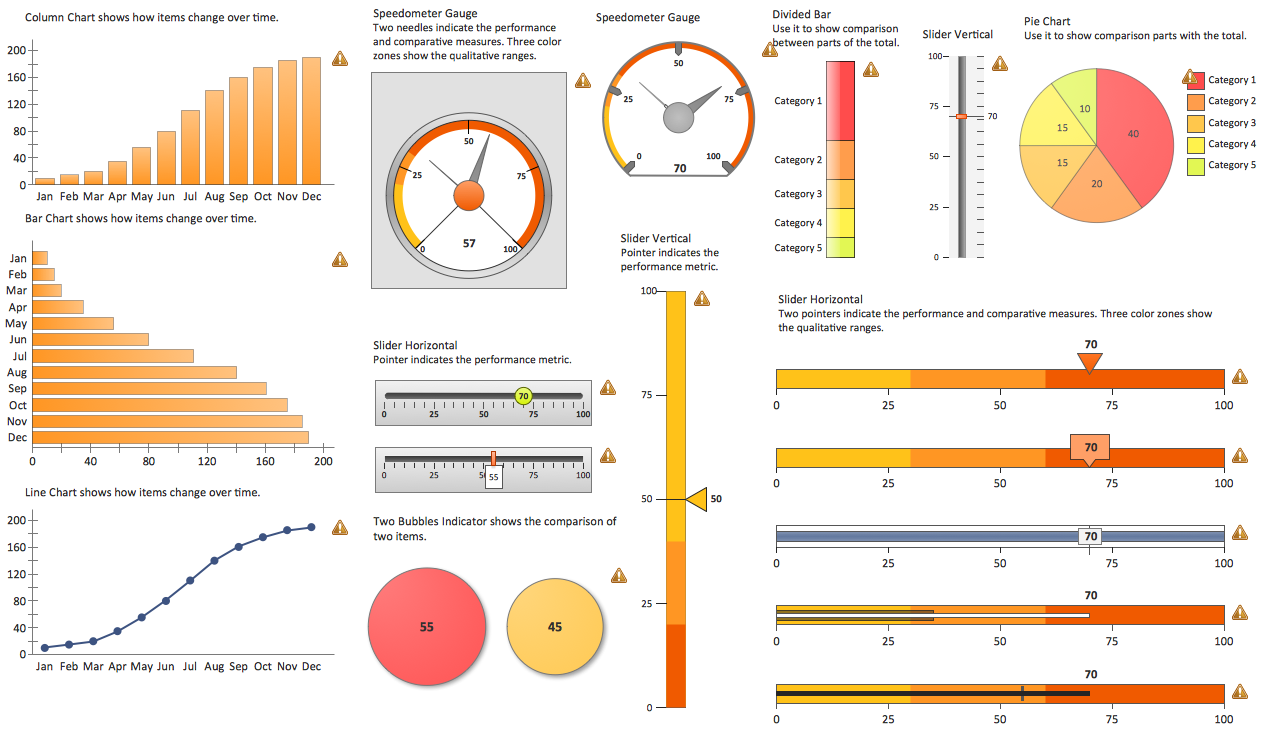
The Facts and KPIs
Visualizing sales data help you see the facts and KPIs about your sales process to make conclusions and see how your business can improve.Sales KPI Dashboards
A combination of sales KPI on a one dashboard helps you track sales activities and results. Visualizing sales data using ConceptDraw DIAGRAM software extended with the Sales Dashboard solutiongives you flexibility in choosing and tuning KPIs.HR Dashboard
The HR Dashboard solution extends ConceptDraw DIAGRAM functionality with powerful drawing tools and great collection of comprehensive vector design elements, icons, pictograms and objects, navigation elements, live objects of HR charts, HR indicators, and thematic maps. The range of HR Dashboards applications is extensive, among them the human resource management, recruitment, hiring process, human resource development. ConceptDraw DIAGRAM software is perfect for creation HR Dashboard with any goal you need. It gives you all opportunities for designing not only informative, but also professional looking and attractive HR Dashboards of any style and degree of detalization, that are perfect for using in presentations, reports and other thematic documents.
TQM Diagram Example
The Total Quality Management Diagram solution helps you and your organization visualize business and industrial processes. Create Total Quality Management diagrams for business process with ConceptDraw software.Reporting & Data Visualization
Using professional reporting and data visualization is the way your business can improve. ConceptDraw Sales Dashboard solution allows you produce live dashboards show KPI to monitor you sales activity and results in real time.
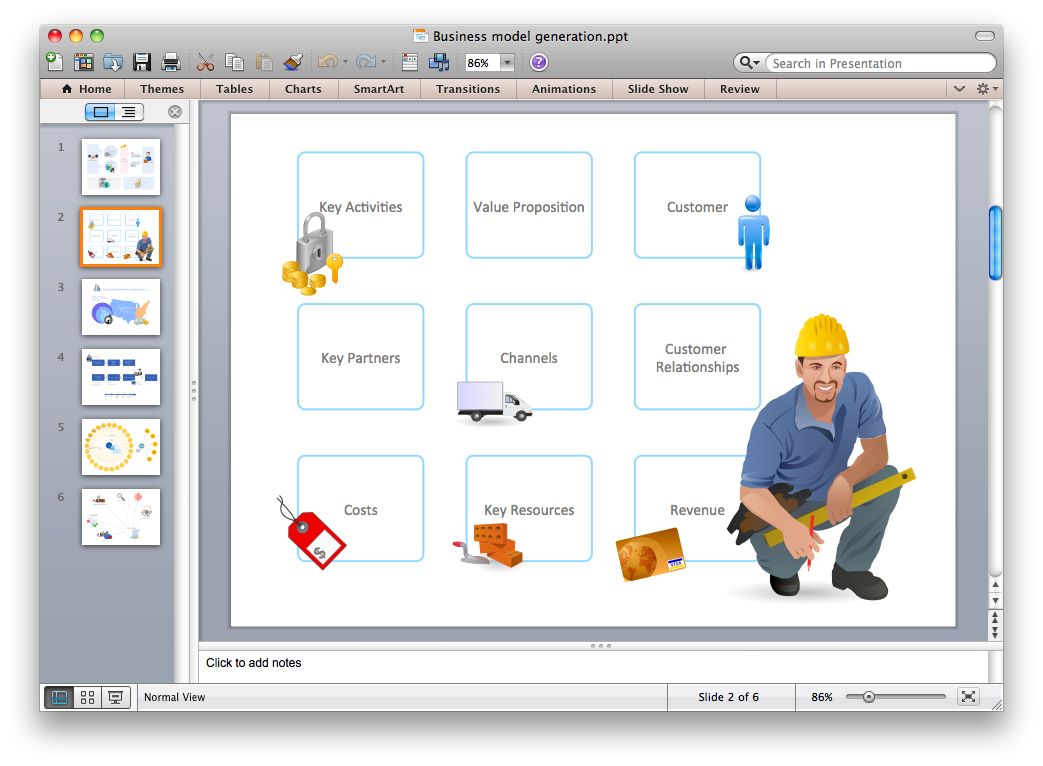
ConceptDraw PROJECT Software Overview
ConceptDraw PROJECT is an effective tool for new and experienced users with a fine balance of usability and powerful functionality.Flowchart Software
Flowchart is widely used in business, education and economic presentations to help the audience visualize the content better, or to find flaws in a process flow diagrams. Flowcharts are particularly useful for displaying how a process currently flow or could ideally function. Flowcharts can help you see whether the steps of a process are logical, uncover problems or miscommunications, define the boundaries of a process, and develop a common base of knowledge about a process.ConceptDraw DIAGRAM flowchart software will help to quickly create new flowcharts, workflow, NS Diagram, BPMN Diagram, Cross-functional flowcharts, data flow diagrams and highlight flowcharts.
Feature-rich flowchart maker, free thousand flowchart examples and templates and colored symbols that will allow you to create professional looking flowcharts simply.
ConceptDraw DIAGRAM supports macOS and Windows.
Export from ConceptDraw DIAGRAM Document to a Graphic File
Now it’s easy to share your visual documents with other people in a form most convenient for them.ConceptDraw DIAGRAM can save your drawings and diagrams in a number of highly useful formats, including graphic files. You can save your drawing as a.PNG,.JPG, or other graphic format file.
Export from ConceptDraw DIAGRAM Document to MS Visio® XML
Once you have created your document in ConceptDraw DIAGRAM and you want to share it with your colleagues and friends, who uses MS Visio on their computers, you can easily export your document using ConceptDraw DIAGRAM export to Visio XML files (VDX) feature.Now you can share your ConceptDraw documents with MS Visio users.
Export from ConceptDraw DIAGRAM Document to PPT or PPTX (MS PowerPoint®) File
ConceptDraw DIAGRAM has extensive export capabilities which allow you to export your drawing to MS PowerPoint file formats. So, you can create effective presentations right from your ConceptDraw DIAGRAM documents.- Sales Dashboard Template | KPI Dashboard | KPIs and Metrics | Ppt ...
- PM Dashboards | Project management task status dashboard ...
- TQM Diagram Example | The Facts and KPIs | How to Report on ...
- Sales Dashboard Template | Business Intelligence Dashboard ...
- Template Powerpoint Kpi
- Kpi Dashboard Requirements Document Template
- Construction Project Management Dashboard Template
- Status Dashboard | Projects HR dashboard | A KPI Dashboard ...
- Sales Report Template
- KPI Dashboard | What is a KPI ? | Performance Indicators | Kpi ...
- ERD | Entity Relationship Diagrams, ERD Software for Mac and Win
- Flowchart | Basic Flowchart Symbols and Meaning
- Flowchart | Flowchart Design - Symbols, Shapes, Stencils and Icons
- Flowchart | Flow Chart Symbols
- Electrical | Electrical Drawing - Wiring and Circuits Schematics
- Flowchart | Common Flowchart Symbols