This infogram sample was created on the base of "UNWTO Tourism Highlights, 2014 Edition (World Tourism Organization UNWTO)". [dtxtq4w60xqpw.cloudfront.net/ sites/ all/ files/ pdf/ unwto_ highlights14_ en_ hr.pdf]
The infographics example "Tourism in the world: key figures" was created using the ConceptDraw PRO diagramming and vector drawing software extended with the Pictorial Infographic solition from the area "What is infographics" in ConceptDraw Solution Park.
The infographics example "Tourism in the world: key figures" was created using the ConceptDraw PRO diagramming and vector drawing software extended with the Pictorial Infographic solition from the area "What is infographics" in ConceptDraw Solution Park.
Basic Flowchart Symbols and Meaning
Flowcharts are the best for visually representation the business processes and the flow of a custom-order process through various departments within an organization. ConceptDraw PRO diagramming and vector drawing software extended with Flowcharts solution offers the full set of predesigned basic flowchart symbols which are gathered at two libraries: Flowchart and Flowcharts Rapid Draw. Among them are: process, terminator, decision, data, document, display, manual loop, and many other specific symbols. The meaning for each symbol offered by ConceptDraw gives the presentation about their proposed use in professional Flowcharts for business and technical processes, software algorithms, well-developed structures of web sites, Workflow diagrams, Process flow diagram and correlation in developing on-line instructional projects or business process system. Use of ready flow chart symbols in diagrams is incredibly useful - you need simply drag desired from the libraries to your document and arrange them in required order. There are a few serious alternatives to Visio for Mac, one of them is ConceptDraw PRO. It is one of the main contender with the most similar features and capabilities.
Pyramid Diagram
The representation of data in a hierarchical or pyramid-like form is one of the most effective and illustrative ways of structuring the data, information, ideas in different fields, among them marketing, management, business, finances, sales, consulting, media, and some others. Pyramid Diagram perfectly suits for this goal, especially if we talk about the representing some marketing strategies, information systems, social strategies. Pyramid Diagram looks like a triangle or reversed triangle that is divided visually on several layers. Each layer can be colored with its own color, this lets visually highlight important moments. ConceptDraw PRO diagramming and vector graphics software extended with Pyramid Diagrams solution from the Marketing area provides powerful drawing tools, templates, samples, and built-in vector pyramid objects, thus all required tools for equally easy drawing Three level pyramid diagram, Four level pyramid model, Five level pyramid, etc., at this your Pyramid diagrams can have 2D or 3D view as you like.Flow Chart Symbols
The Flowcharts are incredibly useful and popular tool used in science, business, software development, analytics, engineering, marketing, manufacturing, administration, architecture, government, politics, and many other fields thanks to a variety of existing types of flowcharts. A Flowchart is a visual graphical representation of the process, algorithm, or the set of steps taken for problem's solution. Widely used for designing, visualizing and documenting simple and complex processes and programs, they effectively help to understand the process and to find easier the flaws if they are. Each flowchart type supposes the use of its own set of notations for drawing corresponding diagram, which includes the symbols of process, decision, data, document, data base, termination, initiation processes, processing loops, conditions, etc. It is easily design a Flowchart using the special professional flowchart maker - ConceptDraw PRO diagram software with numerous predesigned flow chart symbols grouped in libraries of Flowcharts solution from ConceptDraw Solution Park.Multiprotocol Label Switching (MPLS). Computer and Network Examples
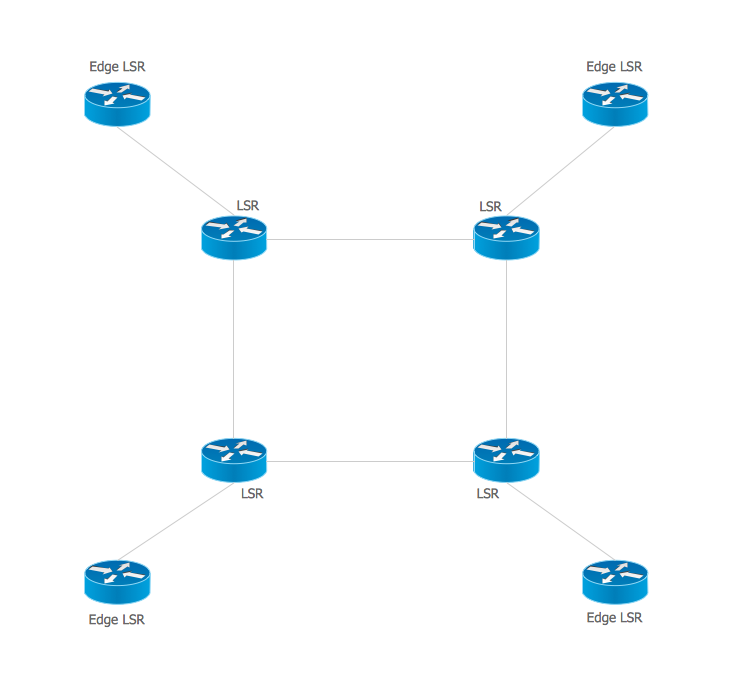
Multiprotocol Label Switching (MPLS) is a mechanism in high-performance telecommunication networks that implements the data transfer from one network node to another using the labels. ConceptDraw PRO is a powerful network diagramming and vector drawing software that provides the Computer and Networks solution with wide set of ready-to-use predesigned vector stencils and examples to help you design the MPLS Networks quick and easy.
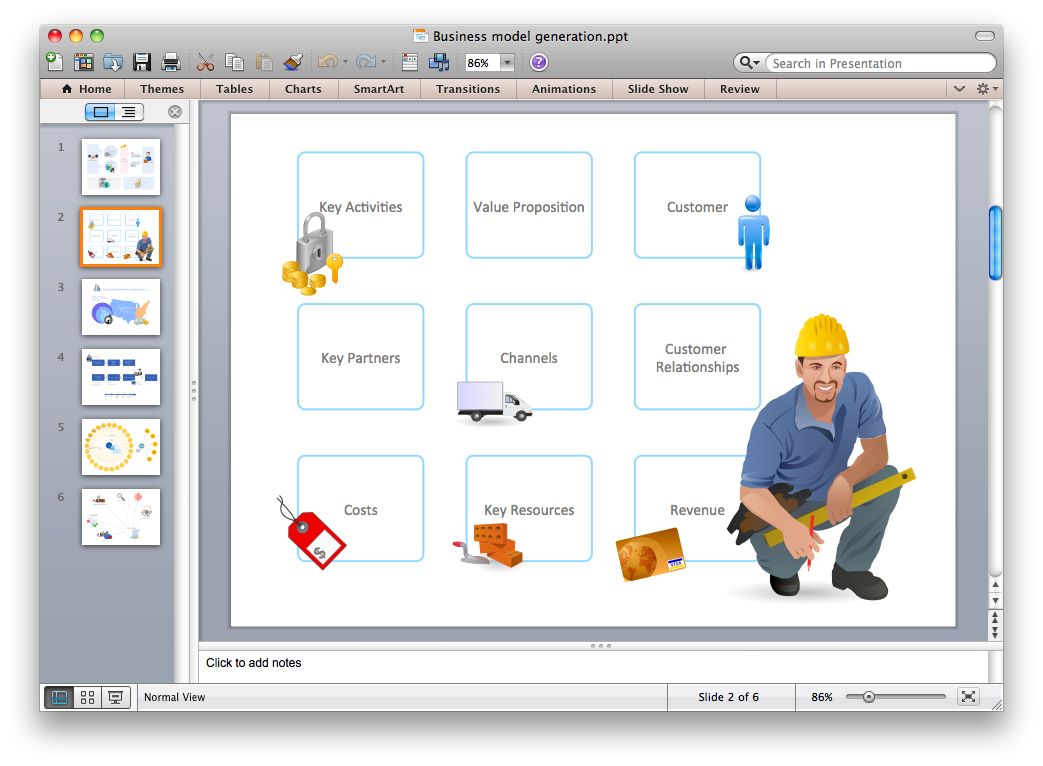
Export from ConceptDraw PRO Document to PPT or PPTX (MS PowerPoint®) File
ConceptDraw PRO has extensive export capabilities which allow you to export your drawing to
How to Create a Scatter Chart
Simple tutorial help you learn how to draw a scatter chart and increase you possibilities of understanding and work more effective with our scatter chart software.Metropolitan area networks (MAN). Computer and Network Examples
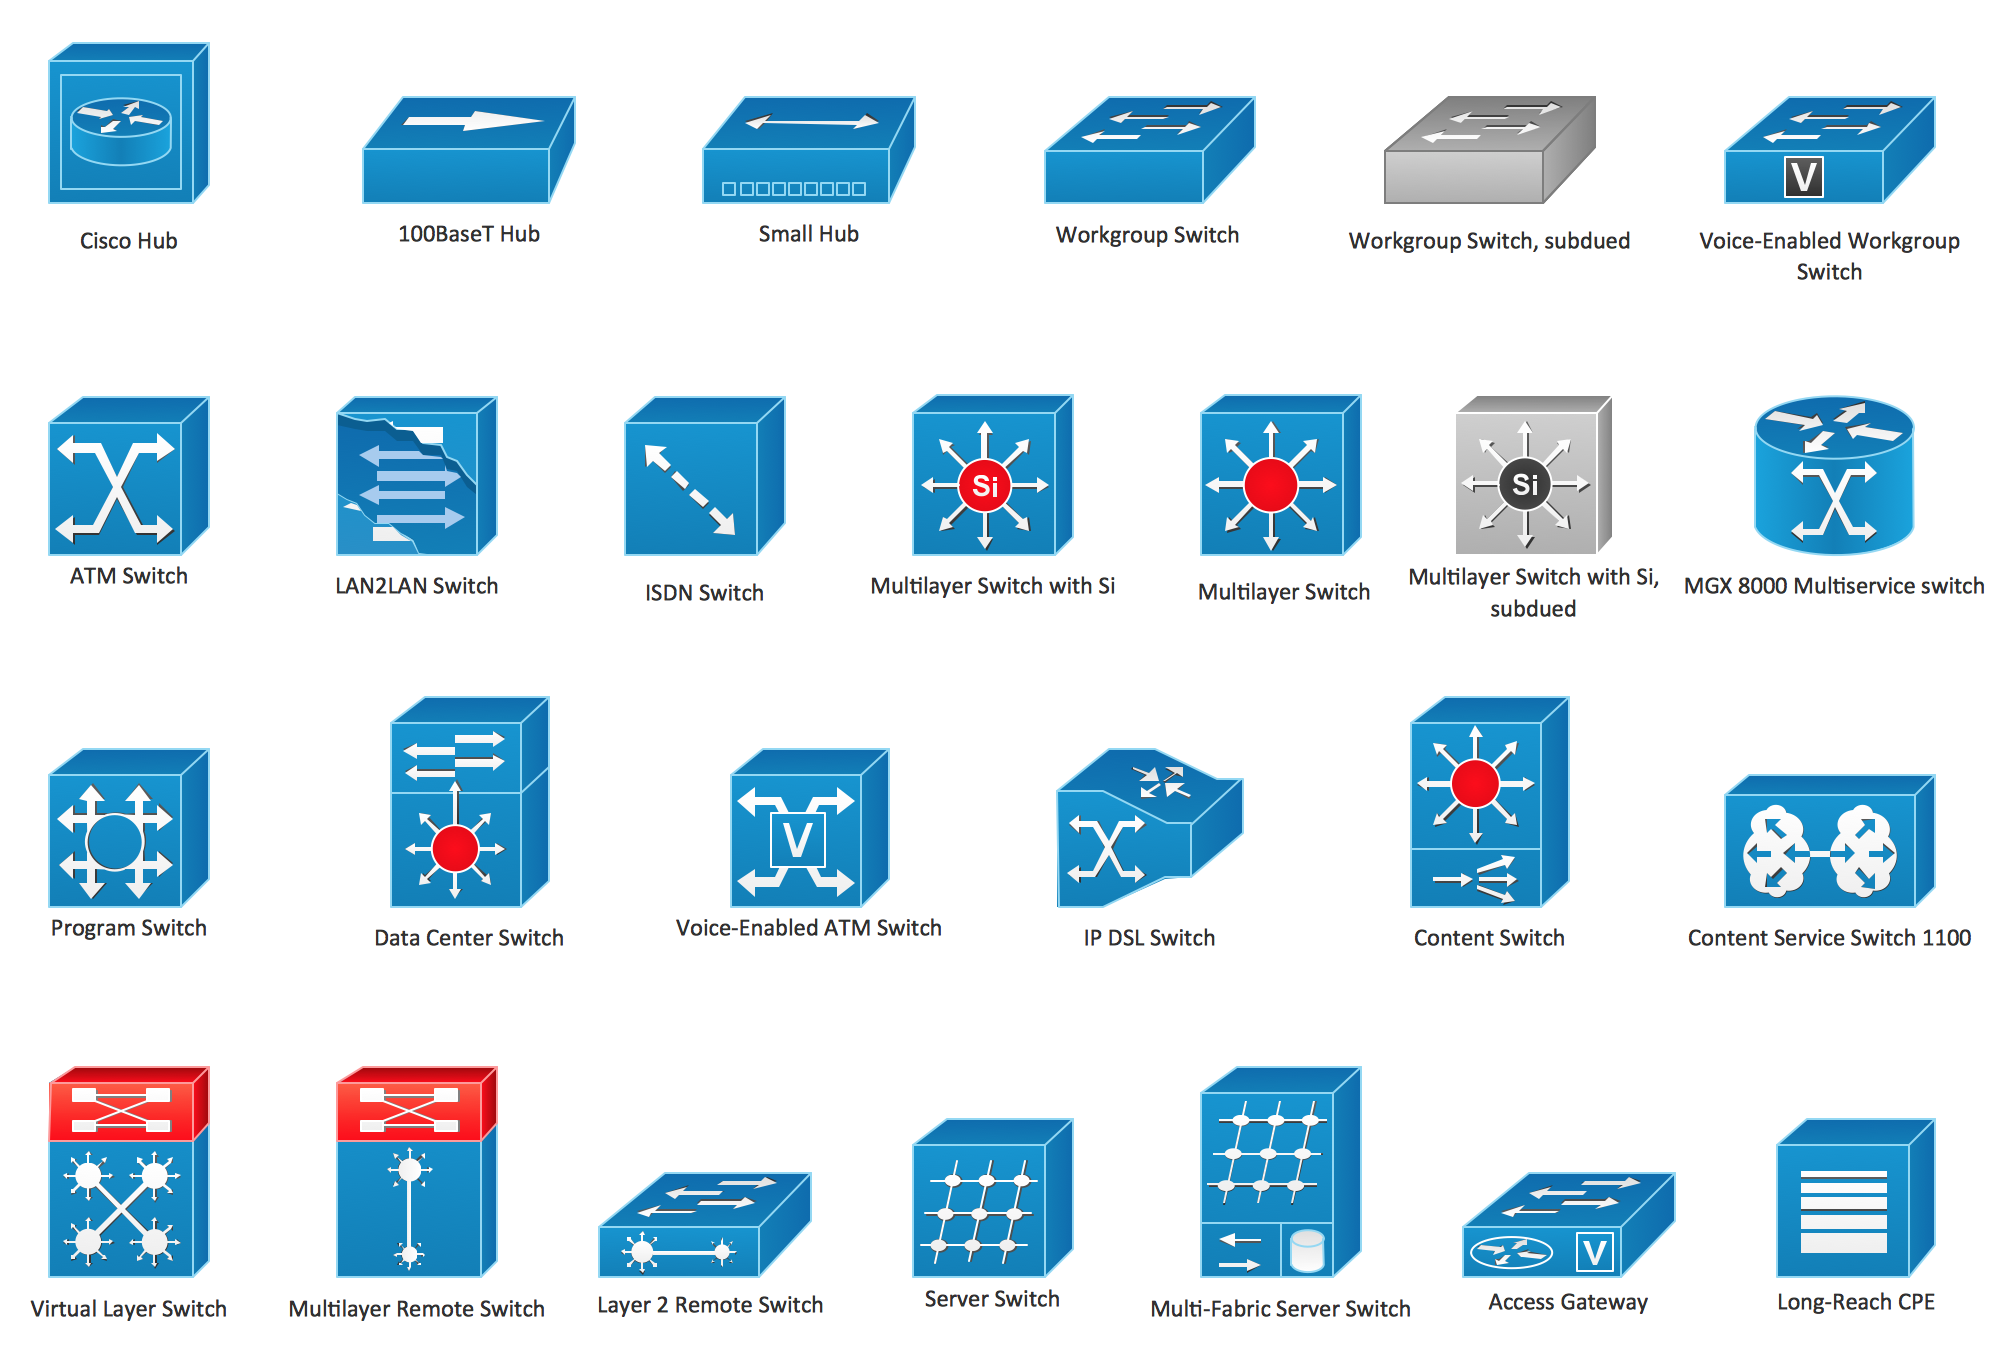
A Metropolitan Area Network (MAN) is a great computer network located on the large geographical area or region. It is a network bigger than Local Area Network (LAN), but territorially smaller than Wide Area Network (WAN), its diameter usually ranges from 5 to 50 kilometers. MAN usually includes several buildings or even the whole city (metropolis). It is based on high data rate compounds using the fiber channels and other digital data transmission channels. MAN includes a lot of communicating devices, for its construction are used multiple routers, switches and hubs. MAN can combine together several Local Area Networks or Campus Area Networks located in different buildings within a city and provides the Internet connectivity for them. Solutions included to Computer and Networks Area for ConceptDraw Solution Park are the real godsend for those who want design Computer Network Diagrams, and among others the Metropolitan Area Network Diagrams. They offer the libraries with ready-to-use vector design elements, professional-looking examples, samples and templates.
 IDEF Business Process Diagrams
Use the IDEF Business Process Diagrams solution to create effective database designs and object-oriented designs, following the integration definition methodology.


