Bubble diagrams in Landscape Design with ConceptDraw DIAGRAM
Bubble Diagrams are the charts with a bubble presentation of data with obligatory consideration of bubble's sizes. They are analogs of Mind Maps and find their application at many fields, and even in landscape design. At this case the bubbles are applied to illustrate the arrangement of different areas of future landscape design, such as lawns, flowerbeds, playgrounds, pools, recreation areas, etc. Bubble Diagram helps to see instantly the whole project, it is easy for design and quite informative, in most cases it reflects all needed information. Often Bubble Diagram is used as a draft for the future landscape project, on the first stage of its design, and in case of approval of chosen design concept is created advanced detailed landscape plan with specification of plants and used materials. Creation of Bubble Diagrams for landscape in ConceptDraw DIAGRAM software is an easy task thanks to the Bubble Diagrams solution from "Diagrams" area. You can use the ready scanned location plan as the base or create it easy using the special ConceptDraw libraries and templates.
 Fault Tree Analysis Diagrams
This solution extends ConceptDraw DIAGRAM.5 or later with templates, fault tree analysis example, samples and a library of vector design elements for drawing FTA diagrams (or negative analytical trees), cause and effect diagrams and fault tree diagrams.
 Computer and Networks Area
The solutions from Computer and Networks Area of ConceptDraw Solution Park collect samples, templates and vector stencils libraries for drawing computer and network diagrams, schemes and technical drawings.
 Plant Layout Plans
Plant Layout Plans solution can be used for power plant design and plant layout design, for making the needed building plant plans and plant layouts looking professionally good. Having the newest plant layout software, the plant design solutions and in particular the ConceptDraw’s Plant Layout Plans solution, including the pre-made templates, examples of the plant layout plans, and the stencil libraries with the design elements, the architects, electricians, interior designers, builders, telecommunications managers, plant design engineers, and other technicians can use them to create the professionally looking drawings within only a few minutes.
HelpDesk
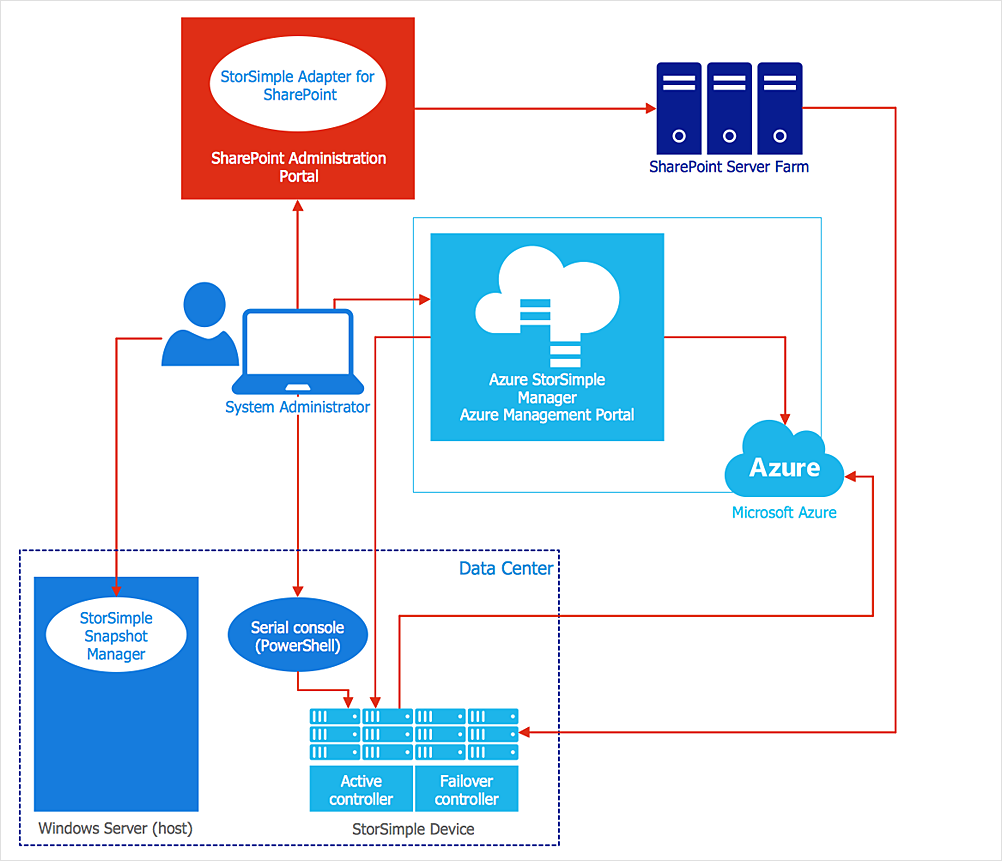
How to Create an Azure Architecture Diagram
Microsoft Azure is an open cloud computing platform, designed by Microsoft. It provides the ability to develop and launch applications and to store data on servers in distributed data centers. Microsoft Azure cloud offers two models - platform as a service (PaaS) and infrastructure as a service (IaaS). The efficiency of the Windows Azure platform is supported by a global network of Microsoft data centers. Developers use Azure Architecture diagrams to visualize and document the architecture of applications based on Microsoft Azure services. Using the ConceptDraw Azure Architecture solution makes much easier the work on documenting the Microsoft Azure architecture.HelpDesk
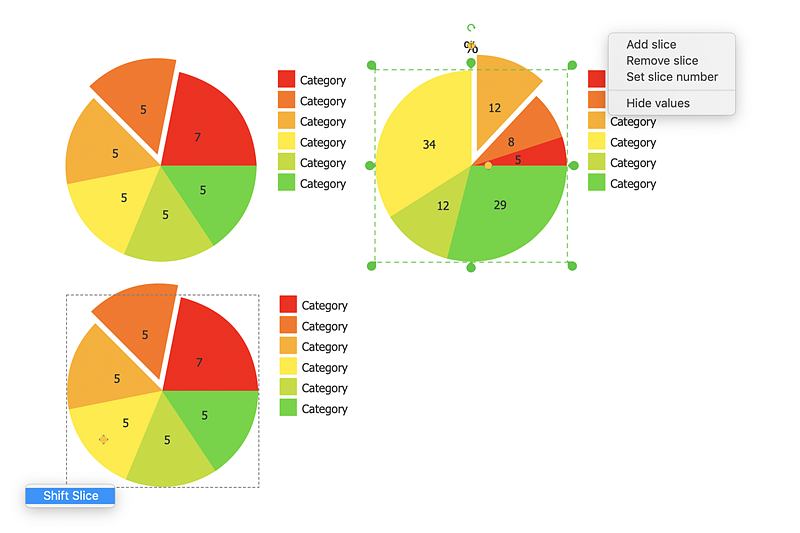
How to Draw the Different Types of Pie Charts
Using the Pie Chart, you can visually estimate the relative contribution that different data categories contribute to a whole value. The pie chart displays the statistics in a visual format. The main use of pie charts to show comparisons. The larger piece of the pie, the more the value of this value compared to the rest. Various applications of pie charts can be found in business and education. For business, pie charts can be used to compare the success or failure of the goods or services. They may also be used to display the business market share.HelpDesk
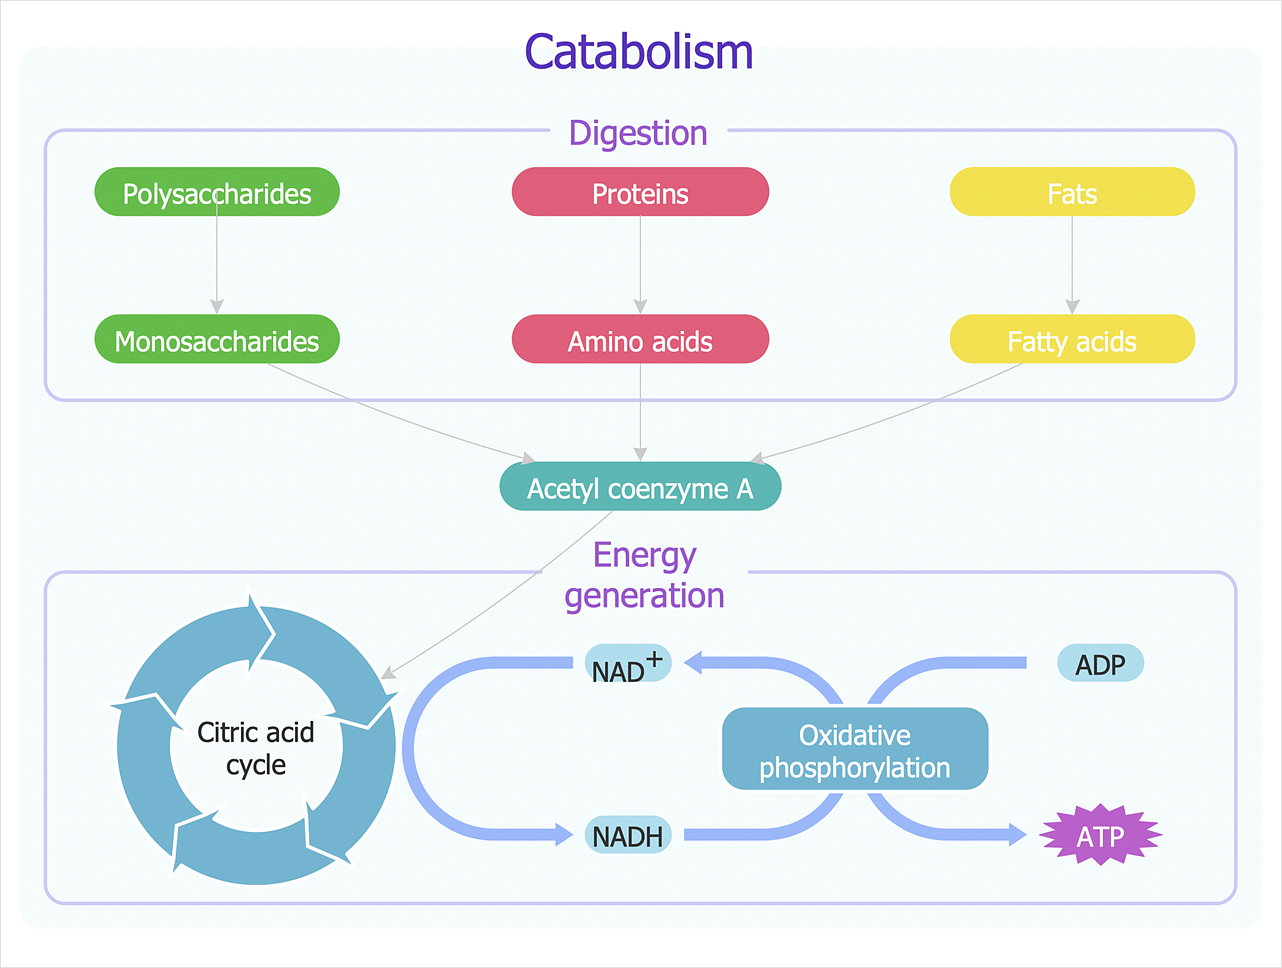
How to a Draw Biology Diagram
Biology is the science studying the living forms of life. A good starting point when studying biology is to use drawings. Drawings help students to comprehend and remember knowledge that is difficult to explain and understand. Students are used to drawing various specific diagrams such as the human circulatory systems or schemes of various biochemical processes. Researchers also need to complete their work with a variety of related diagrams and illustrations. ConceptDraw Biology solution allows you to draw various biological diagrams and schemes easily.- Bubble Chart Maker
- Bubble Diagrams | Bubble diagrams in Landscape Design with ...
- Bubble Diagrams | Bubble Chart Maker | ConceptDraw Solution ...
- How To use Landscape Design Software | Landscape Architecture ...
- Example of DFD for Online Store (Data Flow Diagram) DFD ...
- How To Create a Bubble Chart | Best Diagramming Software for Mac ...
- How to Add a Bubble Diagram to a PowerPoint Presentation Using ...
- Bubble Diagrams | Bubble diagrams in Landscape Design with ...
- Bubble diagrams in Landscape Design with ConceptDraw PRO ...
- Bubble diagrams in Landscape Design with ConceptDraw PRO ...
- Online Visio Creator
- Bubble Diagrams | How to Add a Bubble Diagram to a PowerPoint ...
- Bubble diagrams in Landscape Design with ConceptDraw PRO ...
- Bubble diagrams in Landscape Design with ConceptDraw PRO ...
- Conceptdraw.com: Mind Map Software, Drawing Tools | Project ...
- UML Component Diagram Example - Online Shopping
- Bubble Diagrams | CAD Drawing Software for Making Mechanic ...
- Restaurant Bar Floor Plan Creator Online Free
- How To Draw Building Plans | Building Drawing Software for Design ...
- Concept Map Maker | How to Import Mind Maps from FreeMind ...


