Bubble diagrams in Landscape Design with ConceptDraw DIAGRAM
Bubble Diagrams are the charts with a bubble presentation of data with obligatory consideration of bubble's sizes. They are analogs of Mind Maps and find their application at many fields, and even in landscape design. At this case the bubbles are applied to illustrate the arrangement of different areas of future landscape design, such as lawns, flowerbeds, playgrounds, pools, recreation areas, etc. Bubble Diagram helps to see instantly the whole project, it is easy for design and quite informative, in most cases it reflects all needed information. Often Bubble Diagram is used as a draft for the future landscape project, on the first stage of its design, and in case of approval of chosen design concept is created advanced detailed landscape plan with specification of plants and used materials. Creation of Bubble Diagrams for landscape in ConceptDraw DIAGRAM software is an easy task thanks to the Bubble Diagrams solution from "Diagrams" area. You can use the ready scanned location plan as the base or create it easy using the special ConceptDraw libraries and templates.HelpDesk
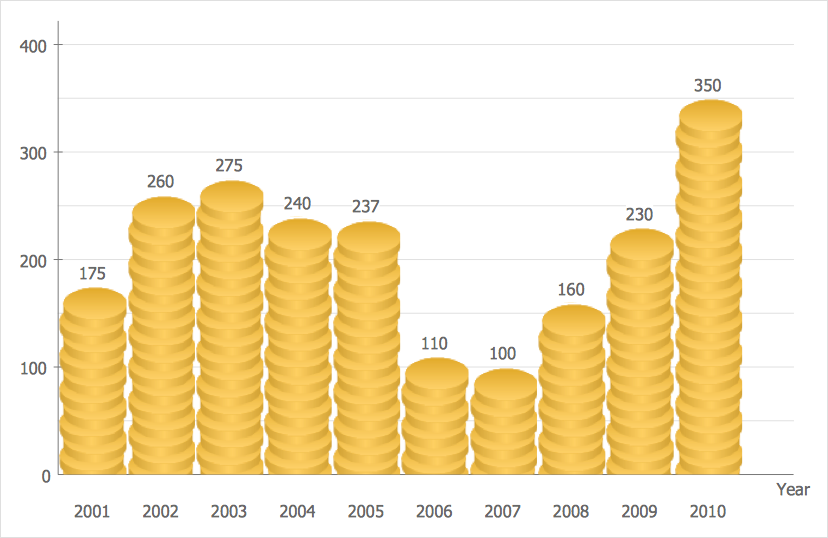
How to Create a Picture Graph
Picture Graphs are used commonly to represent non-complex data to a large audience. A Picture Graph is a simple kind of marketing diagram used to show the relationship among various quantities. It includes pictures or symbols to represent information visually. There are many cases when you have just some numbers to show and compare. This is not a reason to not use visual tools. You can produce a simple picture graph using memorable symbols to get the best visual presentation. Using specific symbols instead of regular colored bars makes picture graphs a much more descriptive tool. You can use tools from an existing library or find appropriate clipart in ConceptDraw’s collection. ConceptDraw DIAGRAM allows you to draw a simple and easy to understand Picture Charts using the special library.- Bubble diagrams in Landscape Design with ConceptDraw PRO ...
- Astronomy Pictures | How to Draw a Natural Landscape | Landscape ...
- Garden Landscape Plans Pictures
- Pictures Of Grass Landscape Elements
- Bubble diagrams in Landscape Design with ConceptDraw PRO ...
- Cafe Garden Landscape Design Pics
- Landscape Architecture with ConceptDraw PRO | Bubble diagrams ...
- Bubble diagrams in Landscape Design with ConceptDraw PRO ...
- Astronomy | UK Map | Education | Example Pictures Of Natural ...
- Drawing Illustration | How to Draw a Natural Landscape | Basic ...
- Bubble diagrams in Landscape Design with ConceptDraw PRO ...
- How to Draw a Natural Landscape | Astronomy | Landscape ...
- Pictures Of A First Aid Room Layout
- How to Draw a Natural Landscape | Chore charts with ConceptDraw ...
- How to Draw a Natural Landscape | Map Software | Map of ...
- Easy Design Pictures For School
- How To use House Electrical Plan Software | Landscape ...
- Electrical Plan Floor Pictures
- First Aid Rooms Floor Plans Pics
- Bubble diagrams in Landscape Design with ConceptDraw PRO ...

