 Landscape & Garden
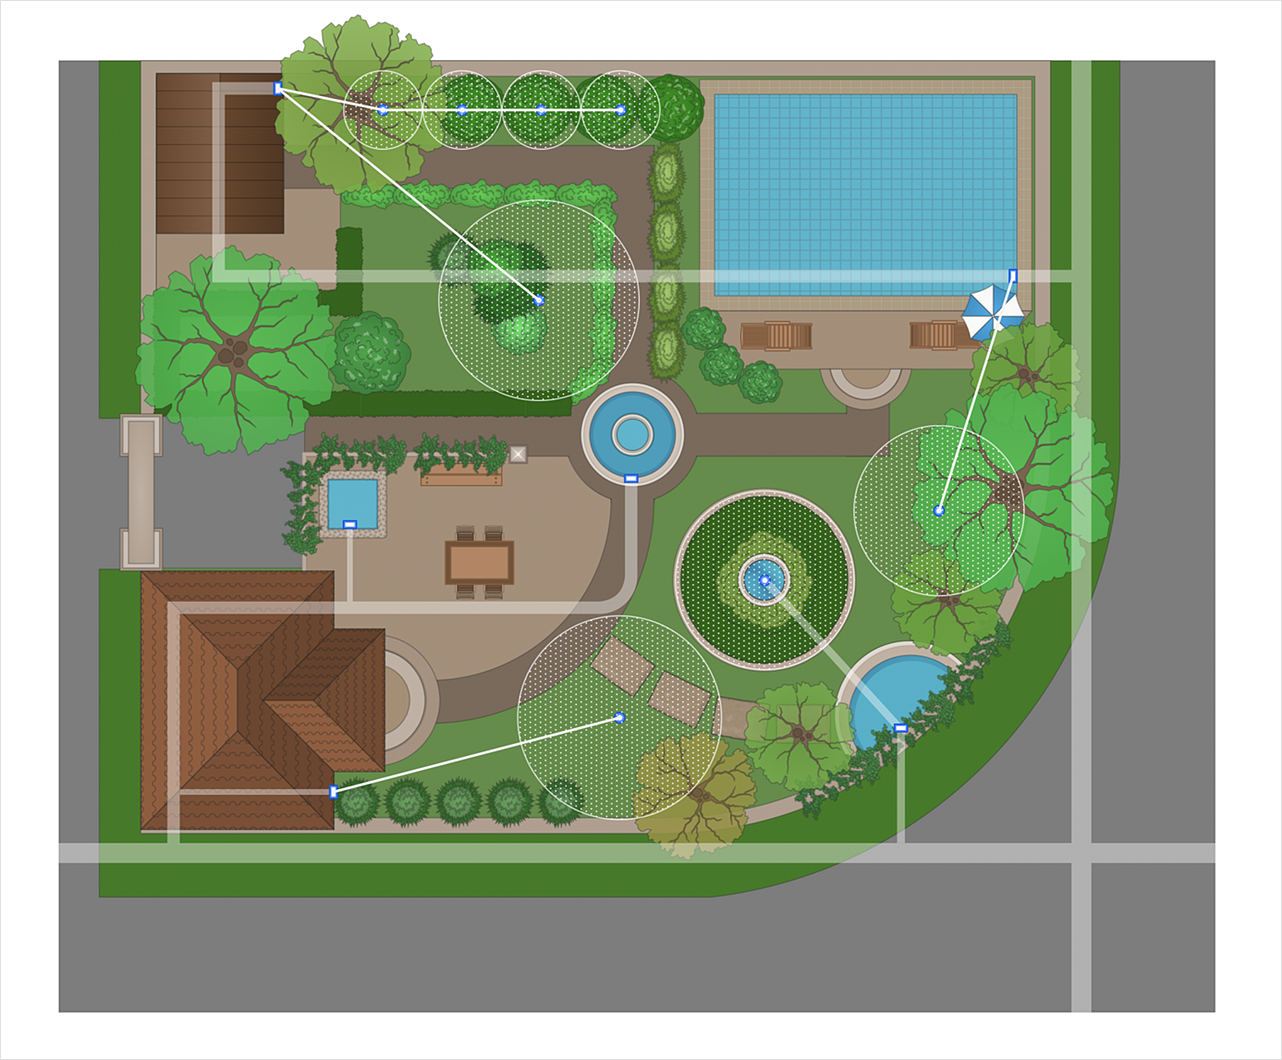
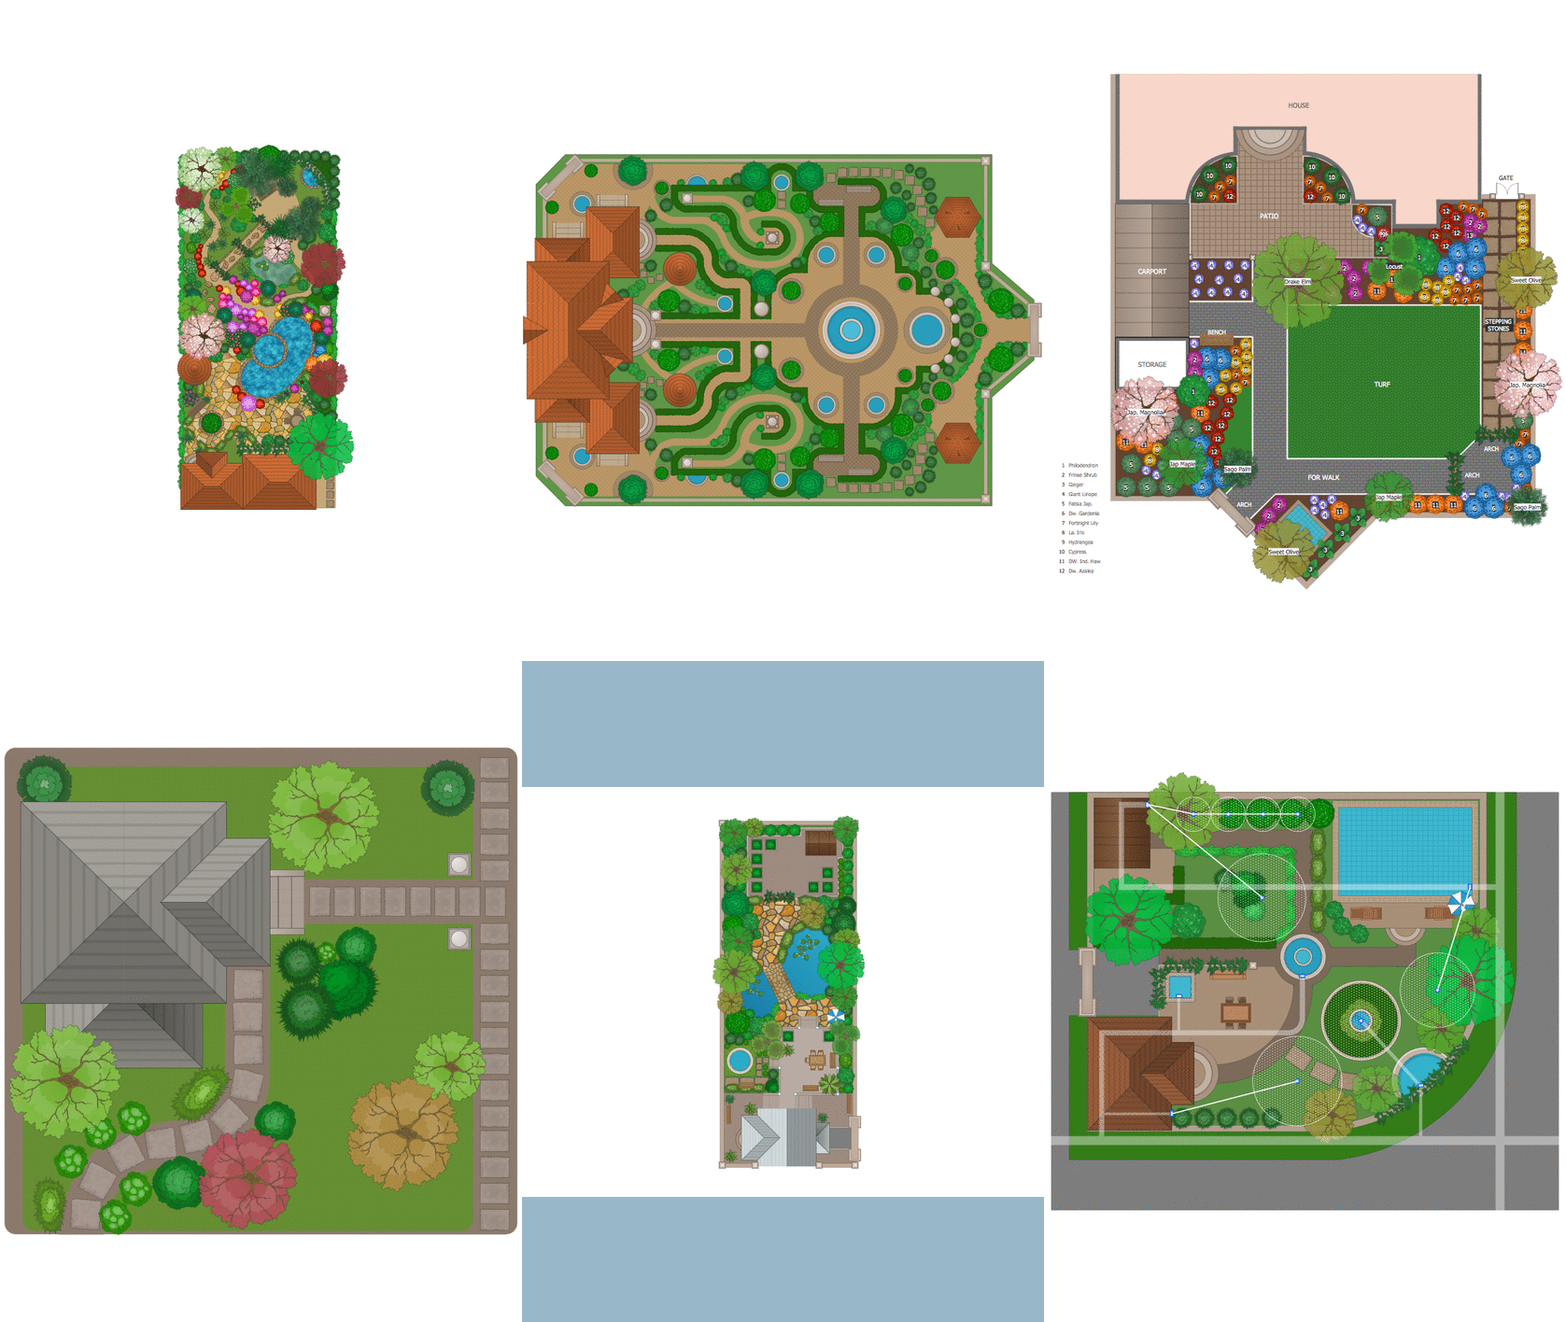
The Landscape and Gardens solution for ConceptDraw DIAGRAM is the ideal drawing tool when creating landscape plans. Any gardener wondering how to design a garden can find the most effective way with Landscape and Gardens solution.
HelpDesk
How to Make a Garden Design
Landscape and garden design involves a varied range of activities that can be managed using ConceptDraw Landscape and Garden solution. Landscape and garden design can embrace landscape management, engineering, detailing, urbanism, assessment, and planning. The Landscape and Garden solution delivers the ability to sculpt your perfect garden design with a range of libraries and templates. These libraries include graphic design elements such as bushes and trees, flower and grass, ponds and fountains, garden furniture and accessories, and paths, plots, and patios. Using them in combination with the handy templates included with the solution is the quickest and simplest method of starting to plan your garden design.Fishbone Diagram Problem Solving
The Ishikawa diagram, Cause and Effect diagram, Fishbone diagram — all they are the names of one and the same visual method for working with causal connections. Originally invented by Kaoru Ishikawa to control the process quality, the Ishikawa diagram is well proven in other fields of management and personal scheduling, events planning, time management. It is a chart in the form of a fish, whose head is a problem, the fins are variants for its causes. To design easily the Fishbone diagram, you can use a special ConceptDraw DIAGRAM ector graphic and diagramming software which contains the powerful tools for Fishbone diagram problem solving offered by Fishbone Diagrams solution for the Management area of ConceptDraw Solution Park.Flow Diagrams
Flow diagrams is a diagram used for structuring complex system and visually representing a flow and interactions of elements in a system. ConceptDraw DIAGRAM diagramming and vector drawing software enhanced with Flowcharts Solution from the "Diagrams" Area of ConceptDraw Solution Park is perfect for easy drawing professional looking Flow Diagrams. For drawing Flow Diagrams the Flowcharts Solution provides: 2 libraries with commonly used predesigned vector objects - Flowchart library and Flowcharts Rapid Draw library; collection of Flow Diagrams samples; Basic Flowchart template.How To use Landscape Design Software
Creation great-looking or even impressive landscape designs is a great labour and real art. There are required the fundamental knowledge in design field, architecture and construction, and also in other special fields, such as plant growing, history, culture, philosophy, etc. Moreover, you need to have good artistic abilities for achievement success in landscape design. All these nuances create the impression that it is incredibly complex process, but ConceptDraw DIAGRAM aims to radically change your opinion and make you closer to the realization of your dream. Now thanks to the Landscape & Garden solution included to the Building Plans area of ConceptDraw Solution Park, you can fully concentrate on the creation the masterpieces in landscape design, without worrying about drawing process. Powerful drawing tools and included numerous collection of samples, templates and pre-designed vector objects are helpful for creation Landscape designs and Landscape plans of any complexity and style, they help you unlock your creativity and design easily the lively garden.Flow Diagram Software
The diagram is a convenient way of representing complex information and data in a simple, visual and comprehensive form. There are used many types of diagrams, each of them has its own fields of application. Flow diagram is a diagram that illustrates the flow or set of dynamic relationships in a system, visually depicts the structure of the elements in a complex system and their interactions. The term Flow diagram is also synonym for a Flowchart. Flow Diagrams are the perfect way to visually represent the structural data. ConceptDraw DIAGRAM extended with Flowcharts solution from the Diagrams area is a professional flow diagram software. The basic set of vector stencils libraries offered by Flowcharts solution, variety of samples and templates developed by specialists, and also advanced RapidDraw technology open before ConceptDraw users wide opportunities in representing the flow processes, in drawing Flow Diagrams and Flowcharts of any type and complexity. Easy tools of exporting to different graphical formats give the possibility of further successful use the diagrams.Best Multi-Platform Diagram Software
ConceptDraw DIAGRAM is a powerful tool for drawing business communication ideas and concepts, simple visual presentation of numerical data in the Mac environment.How To Make a Concept Map
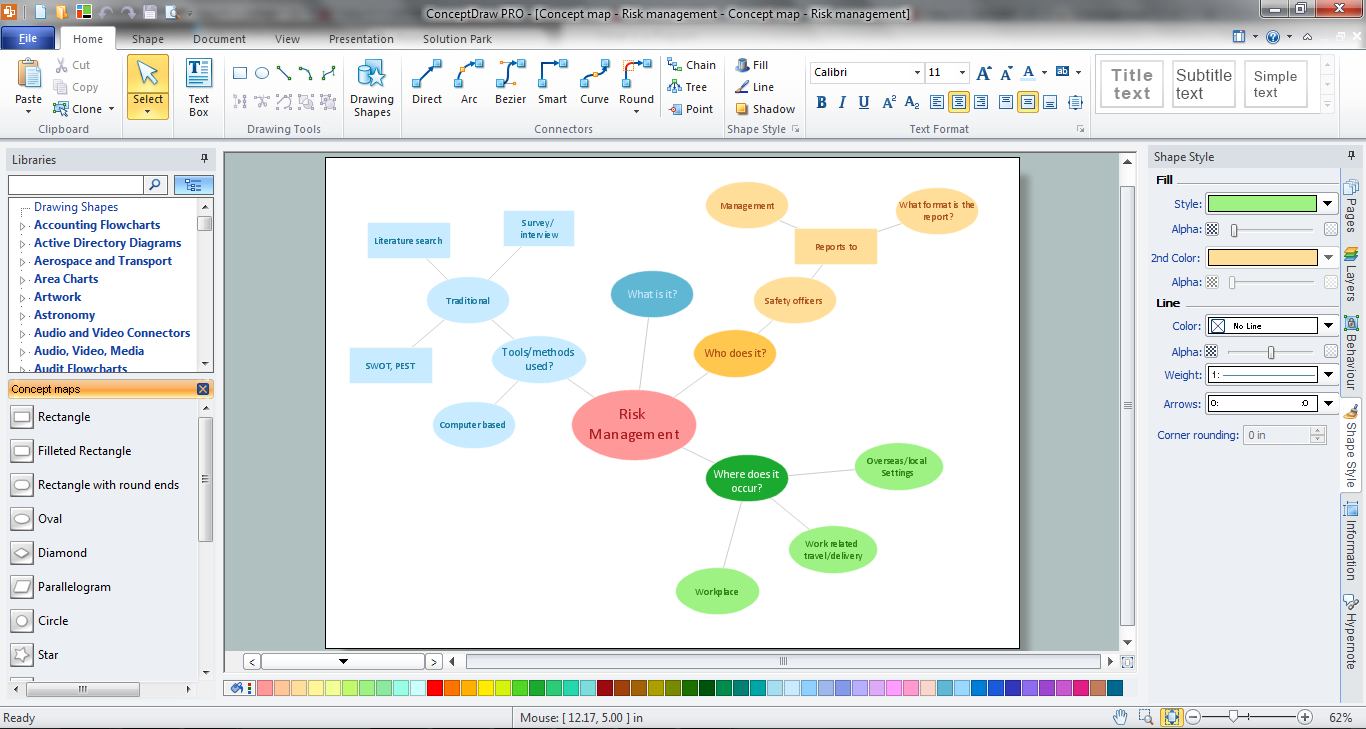
How to make a Concept Map fast and easy? ConceptDraw DIAGRAM diagramming and vector drawing software extended with Concept Maps Solution from the "Diagrams" Area is the best choice for those who want design professional looking Concept Map in minutes.
 IDEF Business Process Diagrams
Use the IDEF Business Process Diagrams solution to create effective database designs and object-oriented designs, following the integration definition methodology.
 Interactive Voice Response Diagrams
Interactive Voice Response Diagrams solution extends ConceptDraw DIAGRAM software with samples, templates and libraries of ready-to-use vector stencils that help create Interactive Voice Response (IVR) diagrams illustrating in details a work of interactive voice response system, the IVR system’s logical and physical structure, Voice-over-Internet Protocol (VoIP) diagrams, and Action VoIP diagrams with representing voice actions on them, to visualize how the computers interact with callers through voice recognition and dual-tone multi-frequency signaling (DTMF) keypad inputs.
- Floor Plans | Bubble diagrams in Landscape Design with ...
- HR Flowcharts | Bubble diagrams in Landscape Design with ...
- Bubble diagrams in Landscape Design with ConceptDraw PRO ...
- Bubble diagrams in Landscape Design with ConceptDraw PRO ...
- Bubble diagrams in Landscape Design with ConceptDraw PRO ...
- Enterprise Architecture Diagrams | Network Diagramming with ...
- 25 Typical Orgcharts | Landscape & Garden | Organizational Charts ...
- Business People Figures | How to Draw a Natural Landscape ...
- Bubble diagrams in Landscape Design with ConceptDraw PRO ...
- AWS Architecture Diagrams | Bubble diagrams in Landscape ...


