Sales Process Flowchart Symbols
The most easier way of creating the visually engaging and informative Sales Process Flowchart is to create the new ConceptDraw document and to use the predesigned vector symbols offered in 6 libraries of the Sales Flowchart Solution. There are more than six types of sales process flow diagrams, ConceptDraw PRO software is flowchart maker which include six collections of extended flowchart symbols for effective diagramming. There are main collections of color coded flowchart symbols: Sales Department, Sales Steps, Sales Workflow, Sales Symbols and special set of Sales Arrows and Sales Flowchart.The vector stencils library "Sales KPIs and Metrics" contains 15 chart templates and graphic indicators of sales key performance indicators (KPIs) and metrics for drawing sales dashboards: line charts "Cost per order" and "Clicks from Sales Follow-Up Emails", column charts "Social Media Usage" and "Usage Rate of Marketing Collateral", horizontal bar charts "Rate of Follow Up Contact", "Cost per customer" and "Lead Response Time", pie charts "Product mix", "Product Performance" and "Rate of Contact", gauge (speedometer) indicators "Sales Growth" and "Actual vs Plan", bullet indicator "Sales Target", diamond alarm indicators "Average Purchase Value", "Quote to Close Ratio", "Opportunity-to-Win Ratio" and "Sales Ratio".
The dashboard charts and indicators example "Design elements - Sales KPIs and metrics" for the ConceptDraw PRO diagramming and vector drawing software is included in the Sales Dashboard solution from the Marketing area of ConceptDraw Solution Park.
www.conceptdraw.com/ solution-park/ marketing-sales-dashboard
Network Components
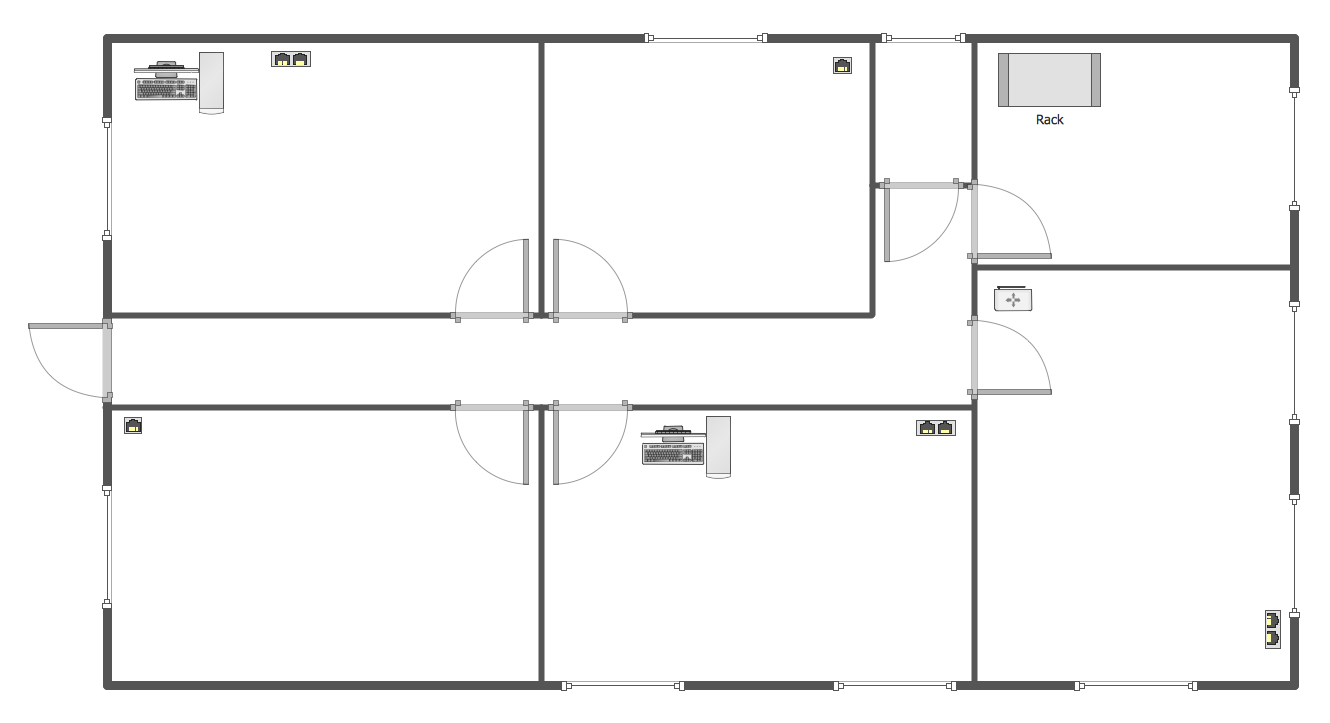
Drawing the network diagrams is a complex process which requires a lot of efforts, time and artistic abilities. ConceptDraw PRO offers the Network Layout Floor Plans Solution from the Computer and Networks Area with variety of predesigned network components for drawing network layout floor plans in minutes.- Design elements - Sales KPIs and metrics | Salesforce Metric ...
- Example Salesforce Chart
- Swim Lane Diagrams | Swim Lanes Flowchart. Flowchart Examples ...
- Daily Schedule Chart | Design elements - Sales KPIs and metrics ...
- KPIs and Metrics | What is a KPI? | Sales KPIs and Metrics - Vector ...
- Design elements - Sales KPIs and metrics | Performance Indicators ...
- Cafe performance metrics vs. air temperature - Visual dashboard ...
- KPIs and Metrics | The Facts and KPIs | KPI Dashboard | Kpis
- KPIs and Metrics | Business Intelligence Dashboard | Meter ...
- Performance Indicators | PM Dashboards | Design elements - Sales ...
- Performance Indicators | Constant improvement of key performance ...
- Performance Indicators | Constant improvement of key performance ...
- Marketing | Target Diagram | The Circular Flow Diagram | Marketing ...
- Visualize Sales Data Using Sample Data | KPIs and Metrics ...
- Internet symbols - Vector stencils library | Network Diagramming with ...
- KPIs and Metrics | Cross-functional flowchart Templates portrait ...
- Management indicators - Vector stencils library | Education ...
- Cloud Computing diagram | Cloud applications | 2-Tier Auto ...
- Management indicators - Vector stencils library | Sales dashboard ...
- A KPI Dashboard Provides the Answers Your Sales Team | KPIs and ...


