Lean Manufacturing Diagrams

Value-Stream Mapping for Manufacturing

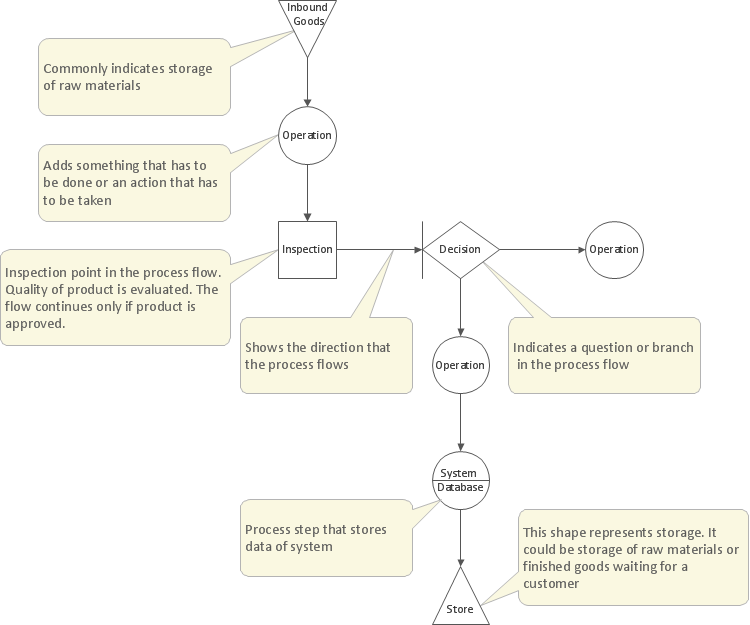
Value Stream Mapping Icons
Learn how to create a current state value stream map

HelpDesk
How to Create a Fishbone (Ishikawa) Diagram Quickly
 Diagram Quickly")
Total Quality Management Business Diagram

Value Stream Diagram

What is Value Stream Mapping?

SWOT Analysis Software

Create TQM Flowcharts for Mac
Identifying Quality Management System

A Study of the Business Value of Total Quality Management
Business Diagram Software


 Value Stream Mapping
Value stream mapping solution extends ConceptDraw DIAGRAM software with templates, samples and vector stencils for drawing the Value Stream Maps (VSM) in lean manufacturing practice.
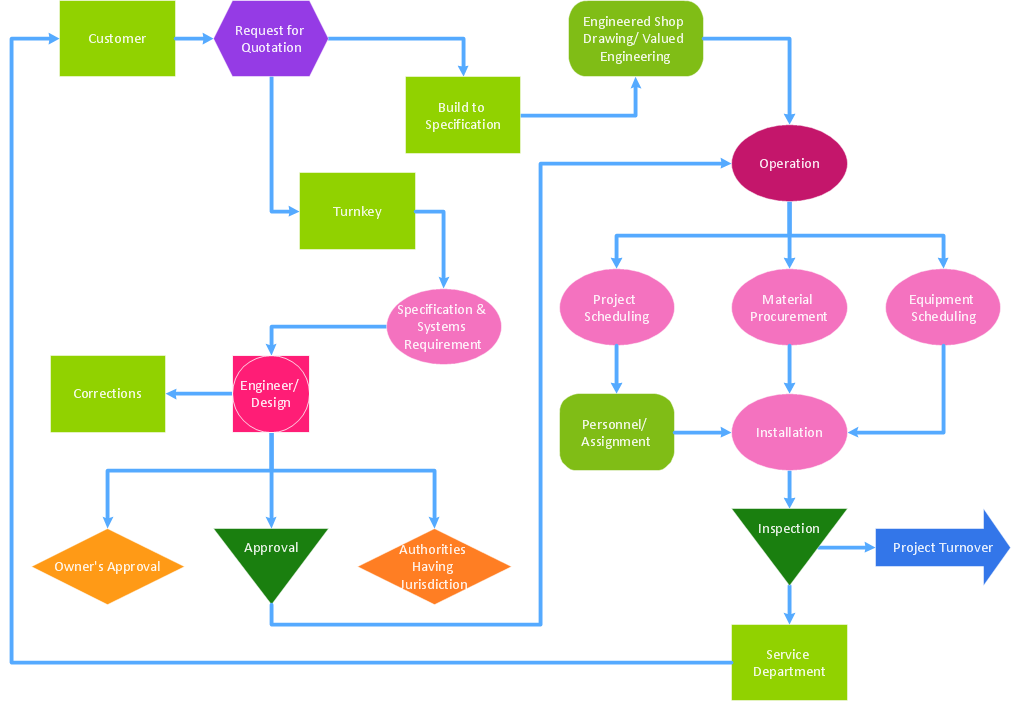
Value Stream & Process Flow Diagramming Software

- Manufacturing 8 Ms fishbone diagram - Template | How Do ...
- Lean Manufacturing Diagrams | Manufacturing 8 Ms fishbone ...
- Manufacturing 8 Ms fishbone diagram - Template | Lean ...
- Fishbone Diagram Template | Lean Manufacturing Diagrams ...
- Lean Manufacturing Diagrams
- Manufacturing 8 Ms fishbone diagram - Template | How Do ...
- Vsm Fish Bone Diagram
- Manufacturing 8 Ms fishbone diagram - Template | Bar Diagrams for ...
- Process Flowchart | Lean Manufacturing Diagrams | Interactive ...
- Fishbone diagram - HAN project | How to Construct a Fishbone ...
- How to Build Cloud Computing Diagram Principal Cloud ...
- Data Flow Diagram Model | Process Flowchart | How Do Fishbone ...
- Process Of Manufacturing Management Diagram
- How to Create a Fishbone ( Ishikawa ) Diagram Quickly | Draw ...
- Visio Fishbone Diagram Template
- Fishbone Diagram | Service 4 Ss fishbone diagram - Template ...
- Manufacturing 8 Ms fishbone diagram - Template | How Do ...
- Lean Manufacturing Diagrams | Lean Six Sigma Diagram Software ...
- The Best Drawing Program for Mac | Lean Manufacturing Diagrams ...