Mind Mapping in the Quality Management
ConceptDraw MINDMAP has a addition to the ConceptDraw Solution Park that provides a creative approach to visualizing quality processes, Quality Mind Map Solution.Business Diagram Software
When managing the projects, people, or networks, there are daily designed and used different types of Business diagrams, so the powerful drawing software will be very useful for this. ConceptDraw DIAGRAM with large quantity of business solutions will meet your needs and will help you convey your ideas successful and rapidly, no matter are you professional or beginner. It is the best choice for business specialists and technical professionals who need quickly and easily explore, visualize, and communicate information. ConceptDraw DIAGRAM business diagram software is the most powerful business software and relational charting software. Create advanced, completely customizable Business Process Diagrams, Business Flow Charts, Work Flow Diagrams, Organizational Charts, Audit diagrams, Marketing diagrams, Value Stream Maps, TQM diagrams, ERD diagrams, EPC diagrams, Cause and Effect diagrams, Infographics, Dashboards, and other Relational business diagrams from your data using the powerful drawing tools of ConceptDraw Solution Park.
Value stream with ConceptDraw DIAGRAM
The Value stream is a totality of all actions on the projection, order composition and production: starting from creation a product project to launching this product, from order to delivery, from extraction of raw materials to ready product manufacturing. Value stream mapping is a process of visualization of these actions and creation of a detailed and graphical map.Introductory Guide to Rapid UML Solution
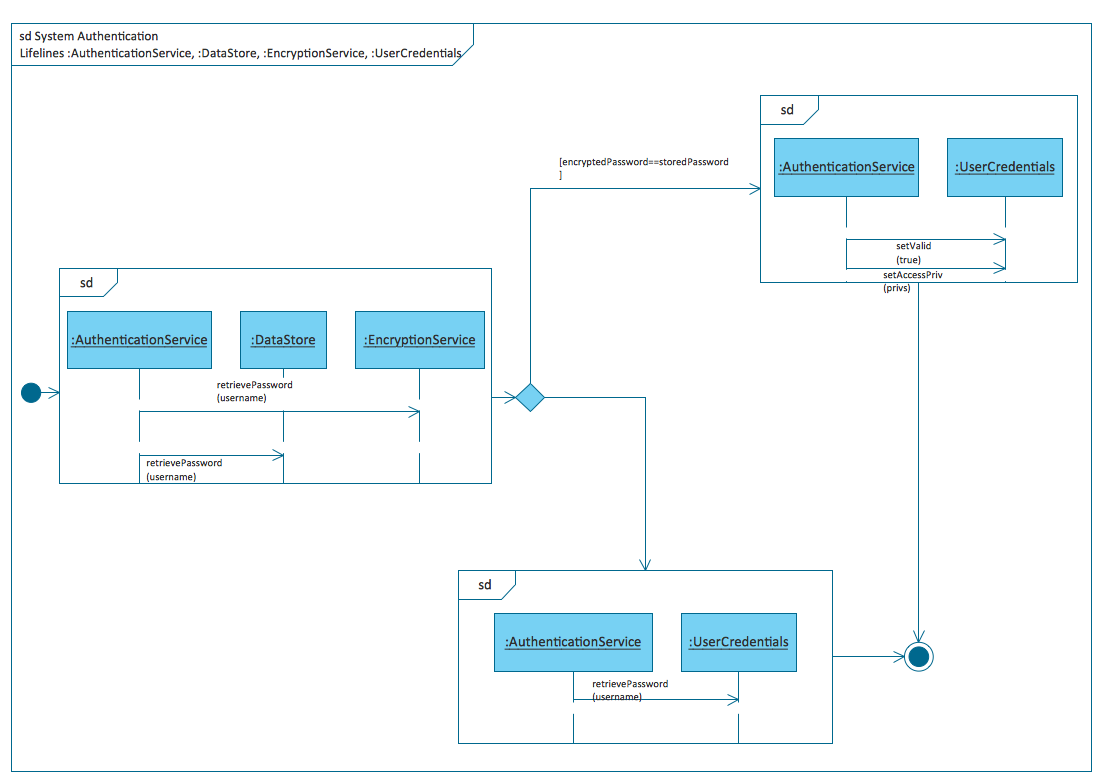
The ability to develop UML diagrams as quickly as the ideas come. The solution uses ConceptDraw RapidDraw techniques. The result is a vector graphic document.- Visual Management Boards Examples
- Visual Management Board Template
- Lean Visual Management Board Examples
- Lean Visual Management Examples
- Quality Dashboards
- Meter Dashboard | BPR Diagram. Business Process Reengineering ...
- Sales Dashboard | Safety and Security | ConceptDraw Solution Park ...
- KPIs and Metrics | Sales metrics and KPIs - Visual dashboard ...
- Visual Management Tools
- PM Dashboards | What Information can be Displayed in the ...
- Status Dashboard | TQM Diagram — Professional Total Quality ...
- Lean Manufacturing Diagrams | Value-Stream Mapping for ...
- Visual Management Kanban
- How to Connect Tabular Data (CSV) to a Graphic Indicator on Your ...
- Lean Manufacturing Diagrams | Value-Stream Mapping for ...
- Value Stream Mapping for the Lean Office | Army Flow Charts | Top ...
- Visual Management Techniques
- Human Resource Development | How To Create a Flow Chart in ...
- Fundamental Tool in Quality Management | Mind Map - Quality ...
- Material Requisition Flowchart. Flowchart Examples | Value stream ...


