Energy Pyramid Diagram
Energy Pyramid Diagram is a visual graphical representation of the biomass productivity on the each trophic level in a given ecosystem. Its designing in ConceptDraw DIAGRAM will not take much time thanks to the unique Pyramid Diagrams solution from the Marketing area of ConceptDraw Solution Park. Energy Pyramid Diagram begins from the producers (plants) and proceeds through a few trophic levels of consumers (herbivores which eat these plants, the carnivores which eat these herbivores, then carnivores which eat those carnivores, and so on) to the top of the food chain.Diagram of a Pyramid
Pyramid diagram is a convenient way of representing data hierarchical structure and visualization relationships between hierarchy levels. You need create the diagram of a pyramid? ConceptDraw diagramming and vector drawing software supplied with Pyramid Diagrams Solution from the Marketing Area of ConceptDraw Solution Park is the best tool for drawing attractive and successful diagram of a pyramid.
 Pyramid Diagrams
Pyramid Diagrams solution extends ConceptDraw DIAGRAM software with templates, samples and library of vector stencils for drawing the marketing pyramid diagrams.
Pyramid Chart Examples
Pyramid Charts and Triangle Diagrams are used to visually structure the topics and progressively order the quantitative data. They allow to illustrate hierarchical structure of the topics, proportional, interconnected and containment relations among the topics. The multilevel Pyramids and Triangle diagrams are constructed oriented up or down and divided into several horizontal slices. They are effectively used to represent marketing strategies, social strategies, information systems, market value, etc., to illustrate presentations, websites, documents, reports in business, finances, sales, management, marketing, media, training, consulting, and many other fields. To maximize the efficiency in drawing the Pyramid Charts, use the ConceptDraw DIAGRAM diagramming and vector drawing software extended with Pyramid Diagrams solution from Marketing area, which contains the set of Pyramid Chart examples, samples, templates and vector design elements of triangular diagrams and pyramids with different quantity of levels for various needs.
 Target and Circular Diagrams
This solution extends ConceptDraw DIAGRAM software with samples, templates and library of design elements for drawing the Target and Circular Diagrams.
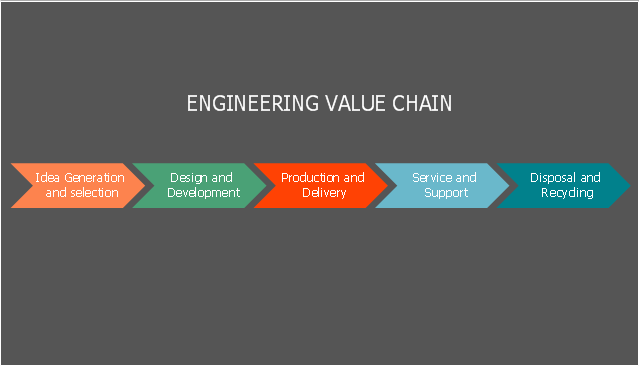
This step chart sample shows engineering value chain. It was designed on the base of the Wikimedia Commons file: The engineering value chain.png. "The engineering value chain (EVC) refers to a series of engineering activities and capabilities contributing to value creation encompassing essential elements such as idea generation & selection, design & development, production & delivery, service & support, and disposal & recycling for example." [commons.wikimedia.org/ wiki/ File:The_ engineering_ value_ chain.png]
This file is licensed under the Creative Commons Attribution-Share Alike 3.0 Unported license. [creativecommons.org/ licenses/ by-sa/ 3.0/ deed.en]
The diagram example "Step chart - Value chain" was created using the ConceptDraw PRO diagramming and vector drawing software extended with the Marketing Diagrams solution from the Marketing area of ConceptDraw Solution Park.
Geo Map — USA — Louisiana
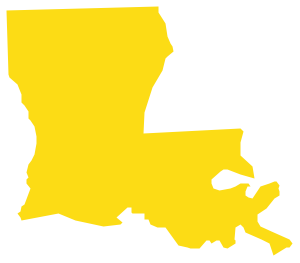
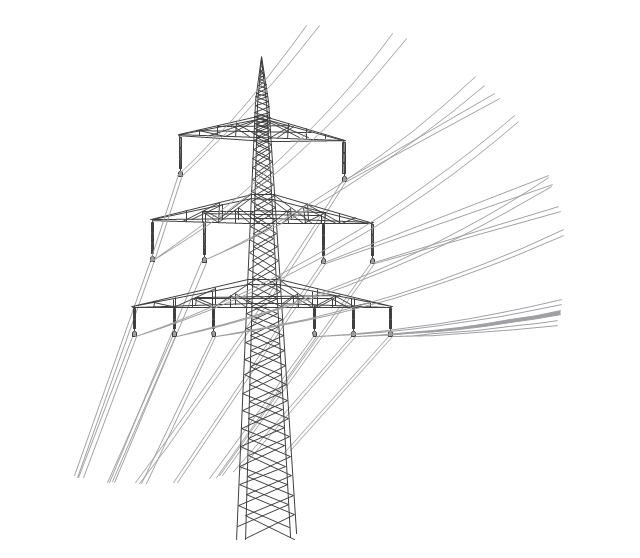
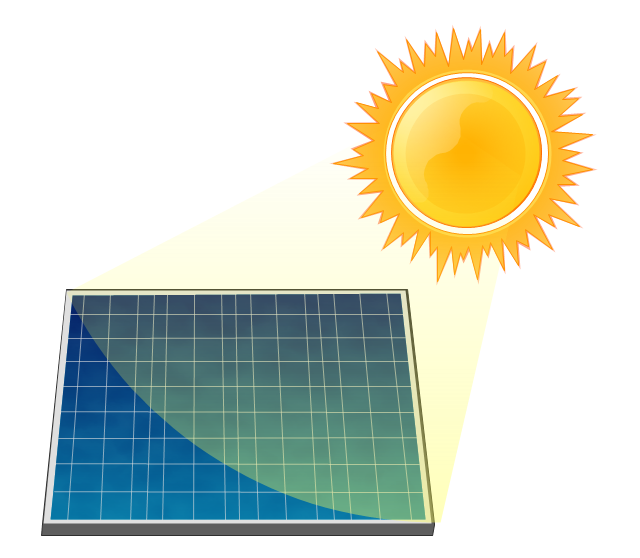
Louisiana is a state located in the southern region of the United States. The vector stencils library Louisiana contains contours for ConceptDraw DIAGRAM diagramming and vector drawing software. This library is contained in the Continent Maps solution from Maps area of ConceptDraw Solution Park.The vector stencils library "Resources and energy" contains 19 clipart images for drawing illustrations on resources and energy.
"Natural resources occur naturally within environments that exist relatively undisturbed by humanity, in a natural form. A natural resource is often characterized by amounts of biodiversity and geodiversity existent in various ecosystems.
Natural resources are derived from the environment. Some of them are essential for our survival while most are used for satisfying our wants. Natural resources may be further classified in different ways.
Natural resources are materials and components (something that can be used) that can be found within the environment. Every man-made product is composed of natural resources (at its fundamental level). A natural resource may exist as a separate entity such as fresh water, and air, as well as a living organism such as a fish, or it may exist in an alternate form which must be processed to obtain the resource such as metal ores, oil, and most forms of energy." [Natural resource. Wikipedia]
The clip art example "Resources and energy - Vector stencils library" was created in ConceptDraw PRO diagramming and vector drawing software using the Manufacturing and Maintenance solution from the Illustration area of ConceptDraw Solution Park.
- Diagram Of Trophic Levels In An Ecosystem
- Block Diagram Of Ecosystem
- Ecosystem Structure Diagram
- Ecosystem Pyramid Chart
- Pyramid Chart Examples | Social Ecological Model (SEM) - Onion ...
- Easy Diagrams Of Ecosystem
- Energy Pyramid Diagram | Diagram of a Pyramid | Ecosystem Map ...
- Energy Pyramid Diagram | Pyramid Chart Examples | Ecosystem ...
- Energy Pyramid Diagram | Diagram of a Pyramid | Pyramid ...
- Energy Pyramid Diagram | Ecosystem goods and services ...
- Flow Chart On Ecosystem
- Pyramid Chart Examples | Diagram of a Pyramid | Energy Pyramid ...
- Venn Diagram Examples for Problem Solving. Environmental Social ...
- Ecosystem goods and services - Segmented pyramid diagram ...
- Pyramid Diagram | 5 Level pyramid model diagram - Information ...
- Free 3d Level Of Hierarchy Diagram
- Pyramid Chart Examples | Pyramid Diagram | Ecosystem goods and ...
- 4- level 3D pyramid diagram - Template | 2- Level 3D pyramid ...
- Pyramid Charts | Pyramid Diagram and Pyramid Chart | Energy ...


