Pyramid Diagram
ConceptDraw Pyramid Diagram software allows drawing column charts using predesigned objects or drawing tools.Simple Baseball Field — Sample
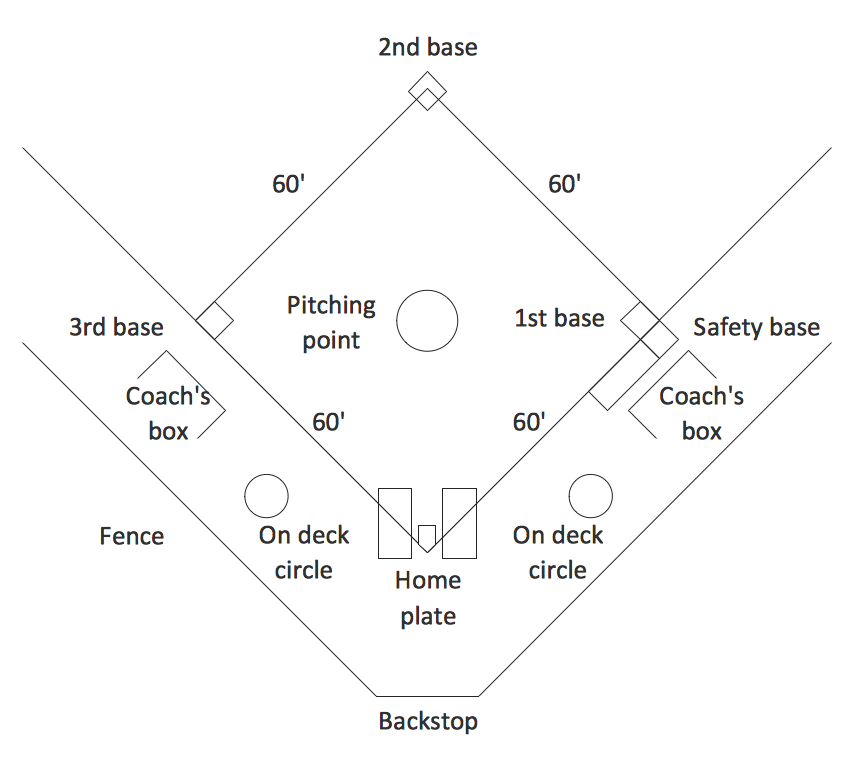
The Baseball solution for ConceptDraw DIAGRAM software contains a set of libraries, templates and samples allowing football specialists to draw baseball diagrams with ease. A set of predesigned fields and positions allows producing baseball diagrams without any drawing experience.Diagramming tool - Amazon Web Services and Cloud Computing Diagrams
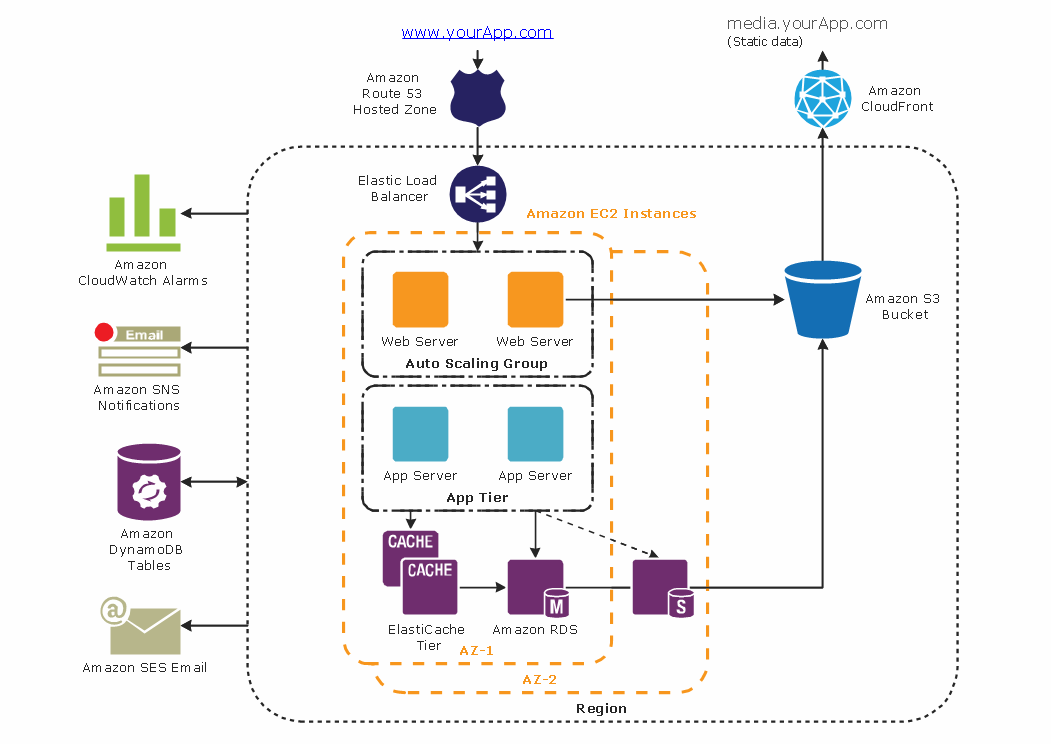
The AWS Architecture Diagrams solution includes icons, sample and templates for several Amazon Web Services products and resources, to be used when creating architecture diagrams. The icons are designed to be simple so that you can easily incorporate them in your diagrams and put them in your whitepapers, presentations, datasheets, posters or any technical material you like.How to draw Metro Map style infographics? Moscow, New York, Los Angeles, London
The solution handles designs of any complexity, and the comprehensive library covers all key aspects of a transportation system. To further enhance your map design, there is the option to embed links, that can display station images or other relevant, important information. We have also included a set of samples in the solution, that show the possible real-world application — complex tube systems including the London Tube and New York City Subway show the level of detail possible when using the Metro Map Solution.Scrum process work items and workflow
Teams working with Scrum methodology use the product backlog items (PBIs), bug work item types (WITs), reports and dashboards. SCRUM Workflow solution for ConceptDraw DIAGRAM software offers collection of samples, variety of predesigned objects, clipart and graphic elements, a set of Scrum process work items and workflow which are developed for agile teams working using Scrum.How to Construct a Fishbone Diagram
Fishbone, Ishikawa or Cause and Effect diagram helps understand the reasons of completed or potential actions by structuring their causes in smaller categories. Also, one can use it to see how the contributing factors are related to each other. In everyday company routine, a Cause and Effect diagram is helpful with a number of regular activities like brainstorming, project management, and problem solving. How to Construct a Fishbone Diagram? Construction a Fishbone diagram in professional diagramming software ConceptDraw DIAGRAM is more easy than you think. Just use the predesigned vector elements from the Fishbone Diagrams library for Fishbone Diagrams solution or one of plenty Fishbone templates and examples, and you will get a Cause and Effect diagram in minutes.Business Process Modeling Notation Template
Create business process diagrams (BPMN 2.0.) with ConceptDraw using professional looking templates and business process improvement tools.How To Create CCTV Network Diagram
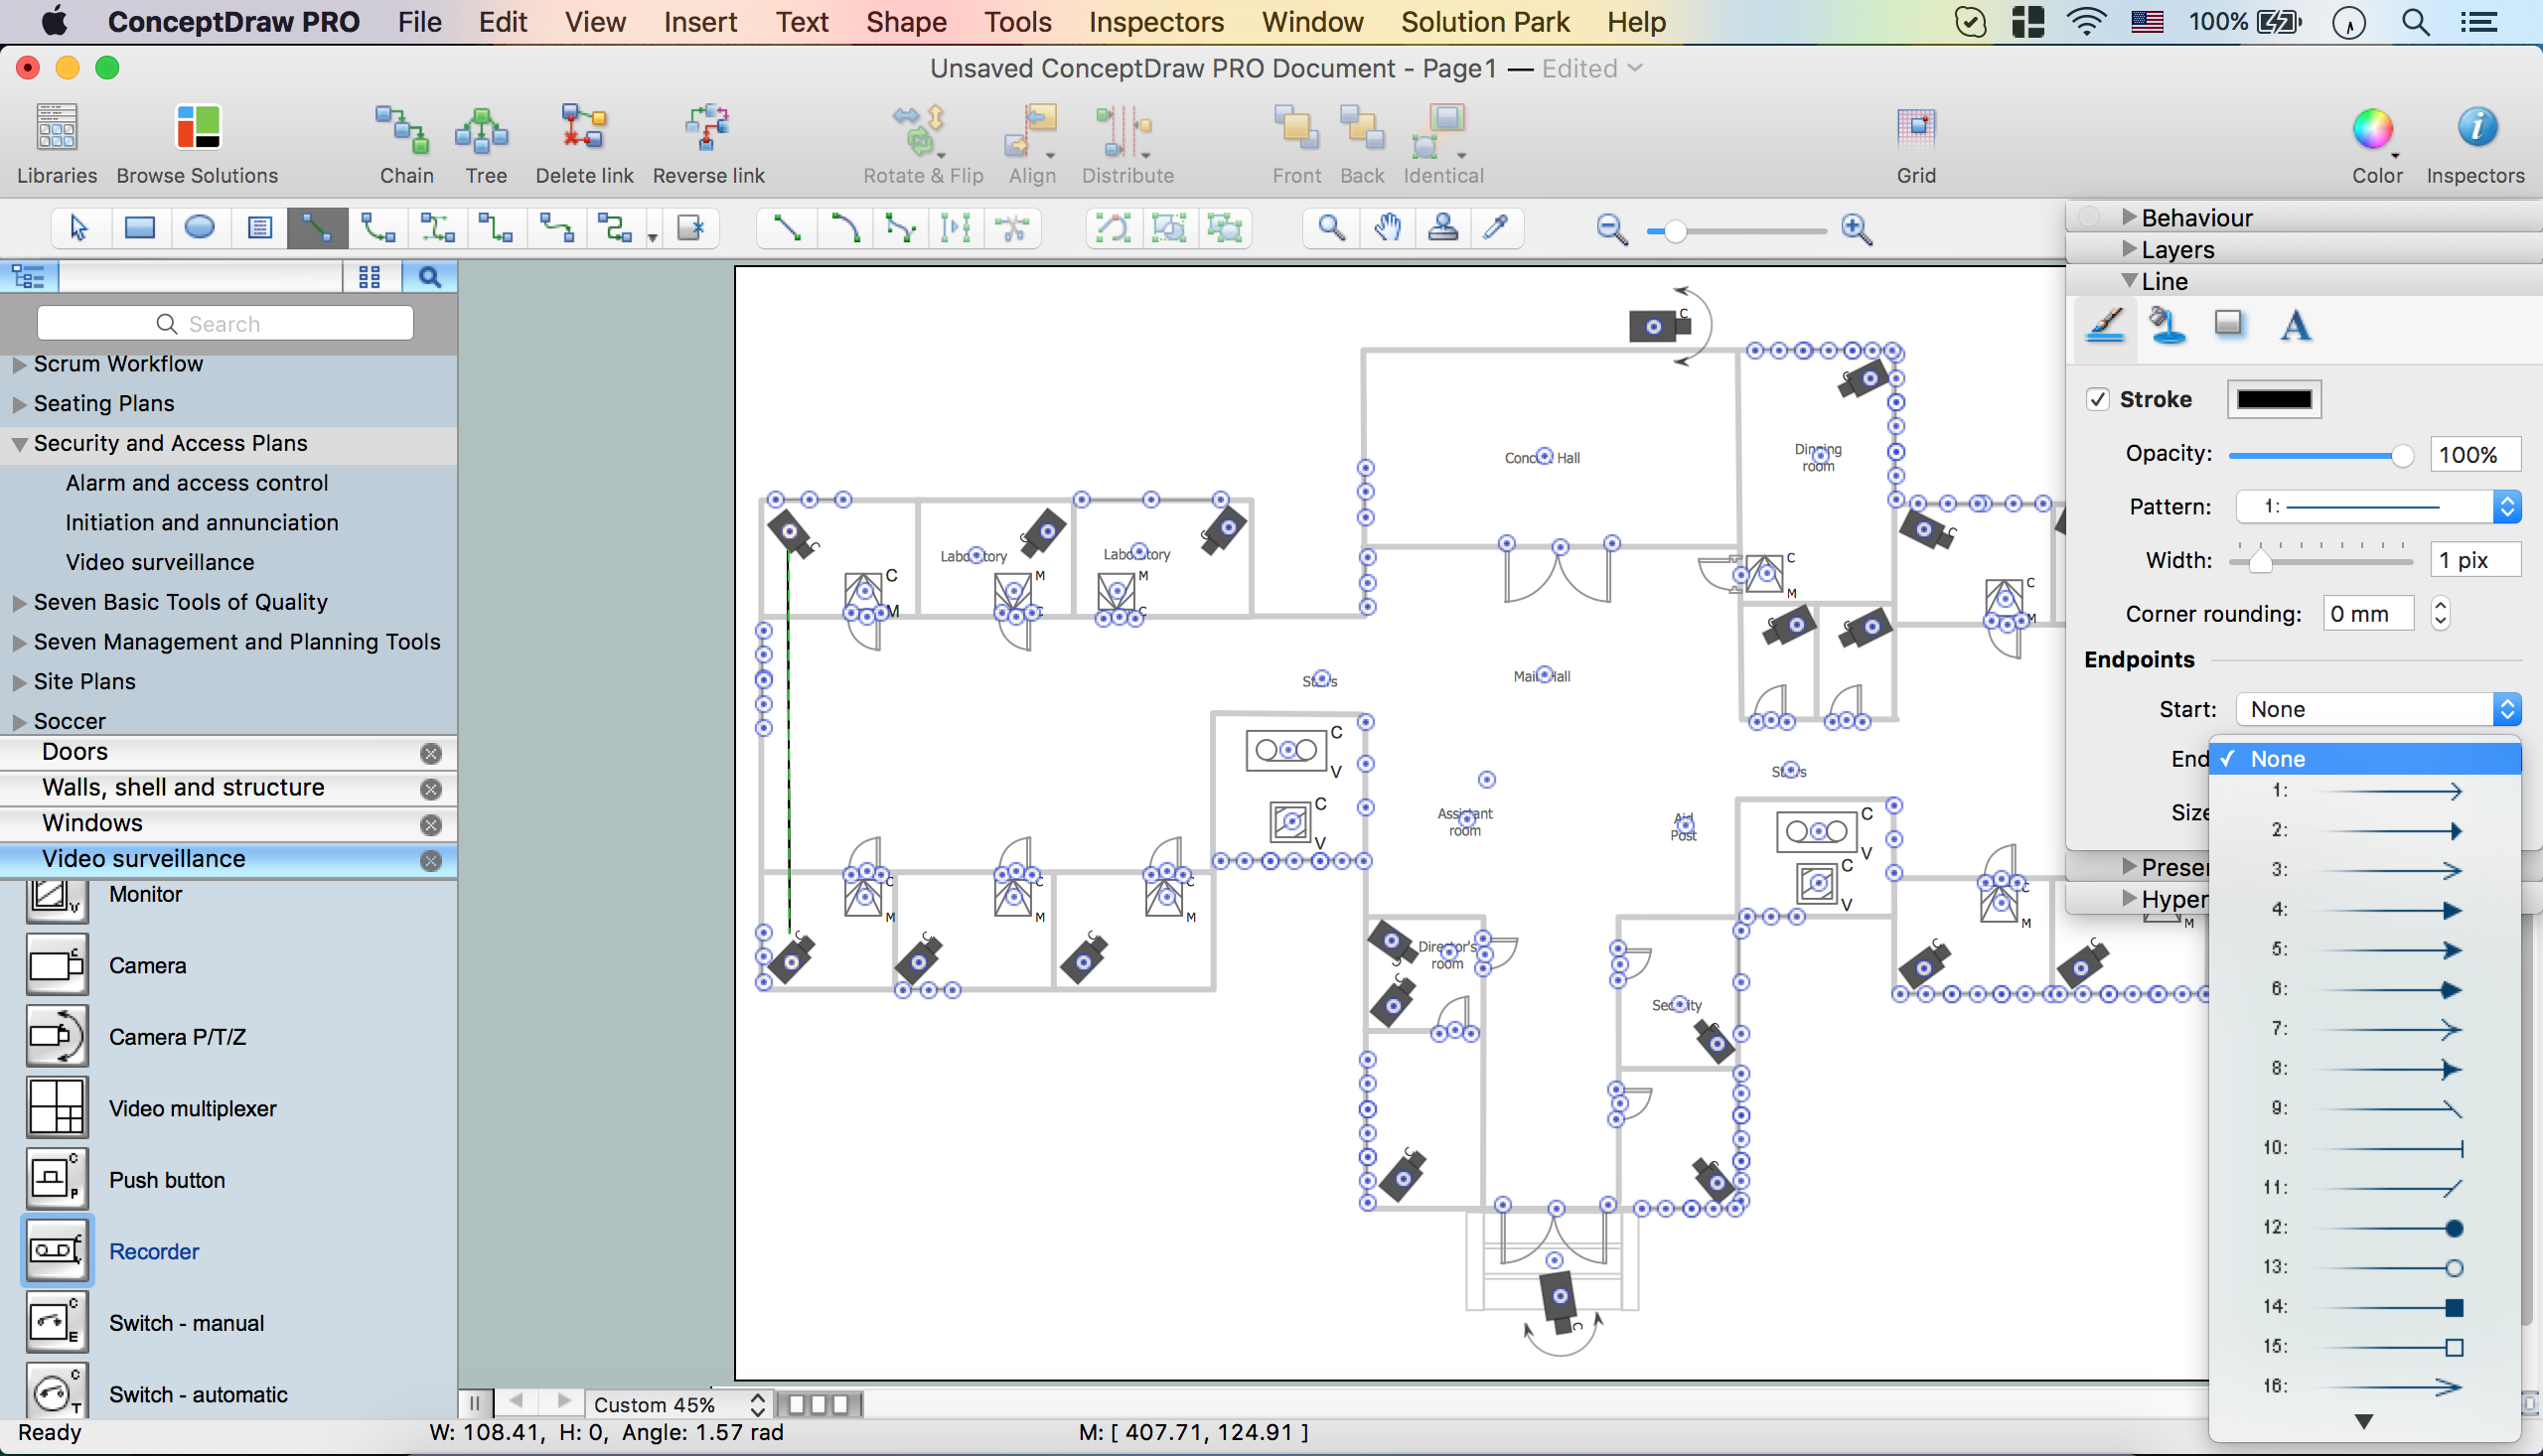
Closed-circuit television (CCTV) uses cameras and monitors to carry out video surveillance. Unlike broadcast television this system has only local signal. It is a feature of almost every video camera, yet CCTV is mainly a system for visual control of certain areas such as banks, airports, supermarkets, and other places for security reasons. Developing and installing CCTV system is a time-consuming process. It also requires certain knowledge and skills. ConceptDraw is a solution of setting video cameras rationally. You can achieve two aims at once: CCTV Design Tool saves your time and your money and helps you make professional video surveillance system.How to Draw a Landscape Design Plan
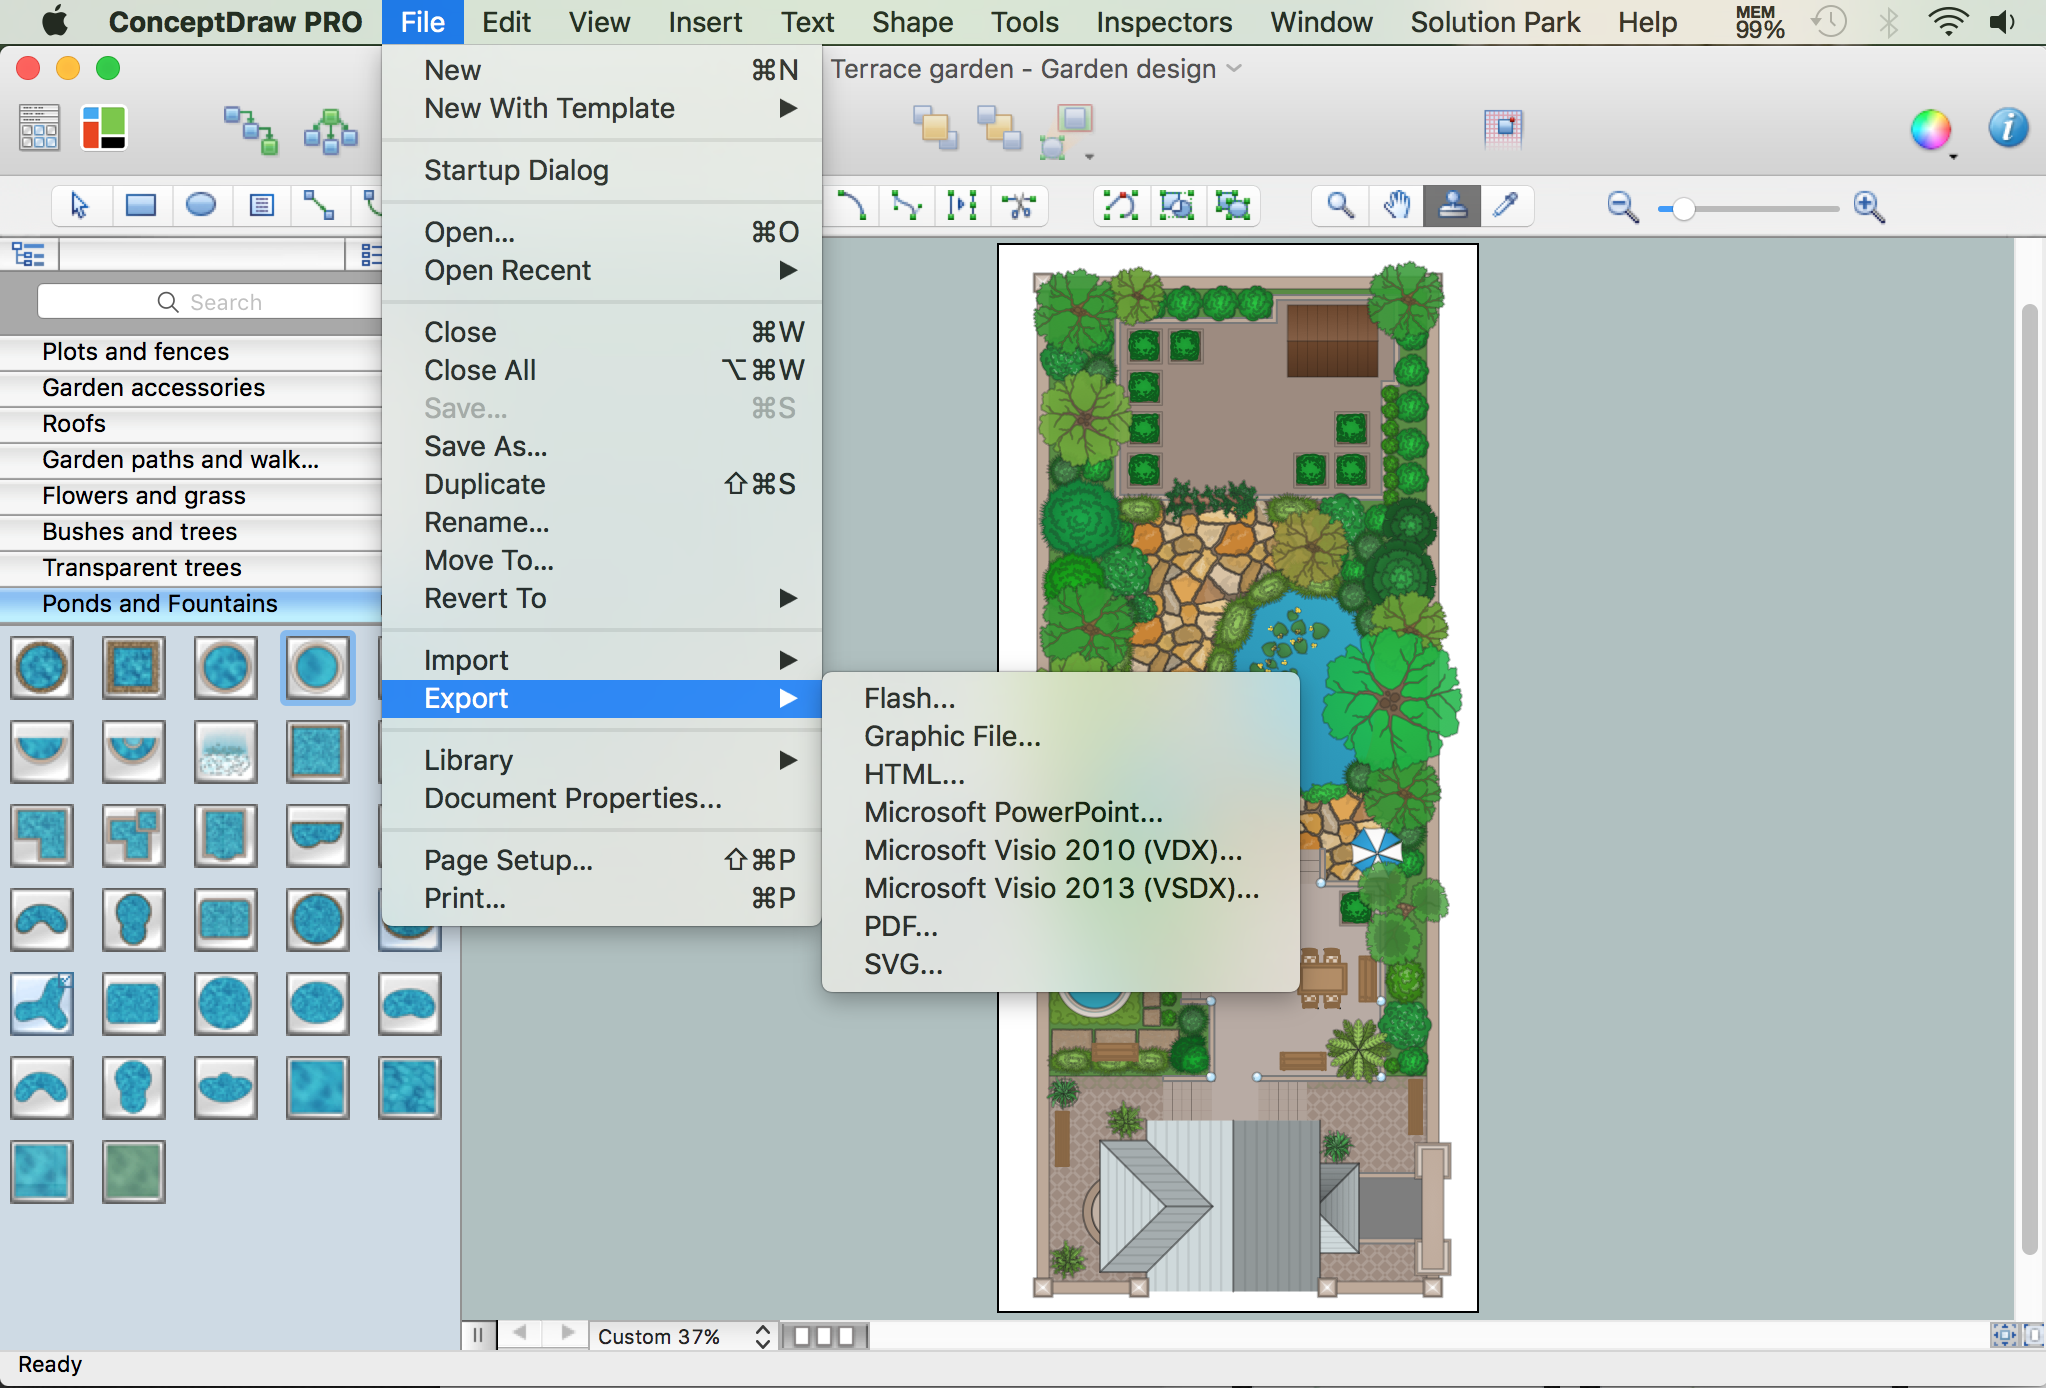
What is landscape design? It's a floor plan but for an outdoor area. Same as a floor plan, a landscape design represents visually any site using scaled dimensions. The main purpose of landscape design is to plan the layout for an outdoor area no matter is it a personal site plan for your home or a commercial plan for business. It may also be handful when a new installation, repair or even an outdoor event is planning. It helps to calculate time and decide which materials should be used in your project. Landscape designs perfectly gives the property owner and landscape contractor better vision for cost estimation, helping to ensure the project time and budget.DFD Library — Design elements
Data Flow Diagrams (DFD) solution from the Software Development area of ConceptDraw Solution Park provides plenty of predesigned templates, samples and DFD vector design elements proposed by three DFD libraries. These DFD library objects are designed to help you effectively model the data flows and functional requirements for the business processes or systems, to design the Process-oriented models or Data-oriented models, Data flowcharts and Data process diagrams, Structured analysis diagrams and Information flow diagrams. There are two different notations used to draw the Data Flow Diagrams (Yourdon & Coad and Gane & Sarson). These notations define the different visual representations for the processes, data stores, data flows, and external entities. ConceptDraw DIAGRAM software provides you with possibility of designing professional-looking Data Flow Diagrams, DFD Models, Data Flow Process Diagrams using any of these notations. Simply drag the predesigned DFD flowchart symbols from the appropriate library and connect by arrows depicting the data flow from one step to another.Security Plans
No security system cannot be constructed without detailed security plan, or even a set of plans in some cases. ConceptDraw DIAGRAM software offers the Security and Access Plans Solution from the Building Plans Area to help you design the Security Plans for any premises and of any complexity.How To Do A Mind Map In PowerPoint
ConceptDraw MINDMAP - an excellent tool for exporting mind maps to PowerPoint to visualize and presenting your project. You can simply generate, change, update your mindmap and then make a presentation in PowerPoint.The vector clipart library "Presentation design elements" contains 45 presentation symbols and arrows which you can easy use in your slides and illustrations.
"A presentation is the process of presenting a topic to an audience. It is typically a demonstration, lecture, or speech meant to inform, persuade, or build good will. ... the use of visuals reduced meeting times... audiences believe presenters who use visuals are more professional and credible than presenters who merely speak. ... meetings and presentations reinforced with visuals help participants reach decisions and consensus more quickly." [Presentation. Wikipedia]
The clip art example "Presentation design elements - Vector clipart library" was created in the ConceptDraw PRO diagramming and vector drawing software using the Presentation Clipart solution from the Illustration area of ConceptDraw Solution Park.
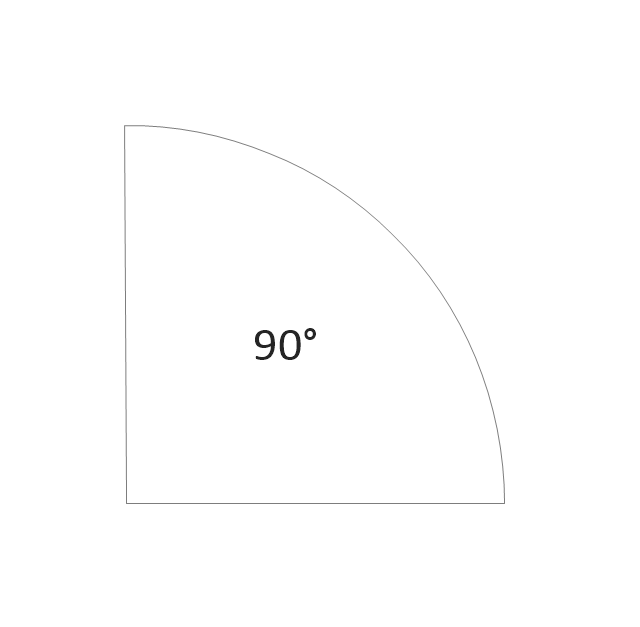
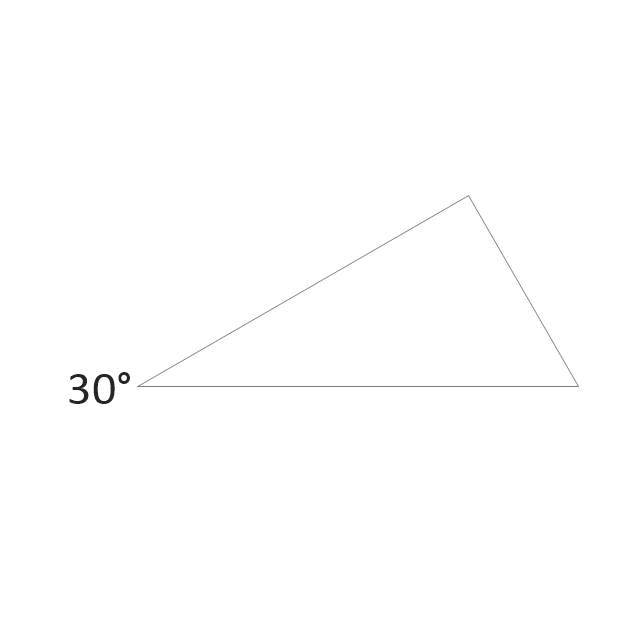
The vector stencils library "Plane geometry" contains 27 plane geometric figures.
Use these shapes to draw your geometrical diagrams and illustrations in the ConceptDraw PRO diagramming and vector drawing software extended with the Mathematics solution from the Science and Education area of ConceptDraw Solution Park.
Use these shapes to draw your geometrical diagrams and illustrations in the ConceptDraw PRO diagramming and vector drawing software extended with the Mathematics solution from the Science and Education area of ConceptDraw Solution Park.
- Plane geometry - Vector stencils library | Gif Science Animations
- Circle Gif
- Square Butt Joint Diagrams
- Diagram Of Single V Butt Weld
- Fishbone Diagram Clip Art Gif
- Welding symbols | Welding - Vector stencils library | Electrical ...
- Transport map - Vector stencils library | Network Topologies ...
- But Joint Diagram Welding
- ConceptDraw PRO ER Diagram Tool | Kpi Animation Gif
- Security Plans | Process Flowchart | Types of Flowchart - Overview ...
- Butt weld geometry | Welding - Vector stencils library | Butt weld ...
- Design elements - Mechanics | Mechanics - Vector stencils library ...
- Butt weld geometry | Welding - Vector stencils library | Design ...
- Butt weld geometry | Welding - Vector stencils library | Welded joints ...
- Phases of the moon | Stars and planets - Vector stencils library ...
- Mathematics Symbols | Butt weld geometry | Mathematical Diagrams ...
- Phone Vector Gif
- Coad/Yourdon's Object-Oriented Analysis model | Data Flow ...
- Data Flow Diagram Symbols. DFD Library | Coad/Yourdon's Object ...
- Circuit diagram - EL 34 schematics

