ConceptDraw PROJECT Software Overview
ConceptDraw PROJECT is an effective tool for new and experienced users with a fine balance of usability and powerful functionality.
 ConceptDraw Solution Park
ConceptDraw Solution Park collects graphic extensions, examples and learning materials
HelpDesk
How to Draw a Circular Arrows Diagram
The cyclic recurrence is a fundamental property of multiple systems. The cycle is a process which consists from elements (phases, stages, stages) following each other. Many processes in astronomy, biology, chemistry, physics, mathematics, etc. have a cycle properties. It is also widely used in information technologies and marketing analysis. Graphical representation of cyclic processes can have many forms. It can be a circle, parabola, hyperbola, ellipse and others. A Circular Arrows Diagram is used as one of the statistical charts in the business, mass media and marketing. ConceptDraw DIAGRAM provides its users tools for making easy drawing Circular Arrows Diagrams.
 Venn Diagrams
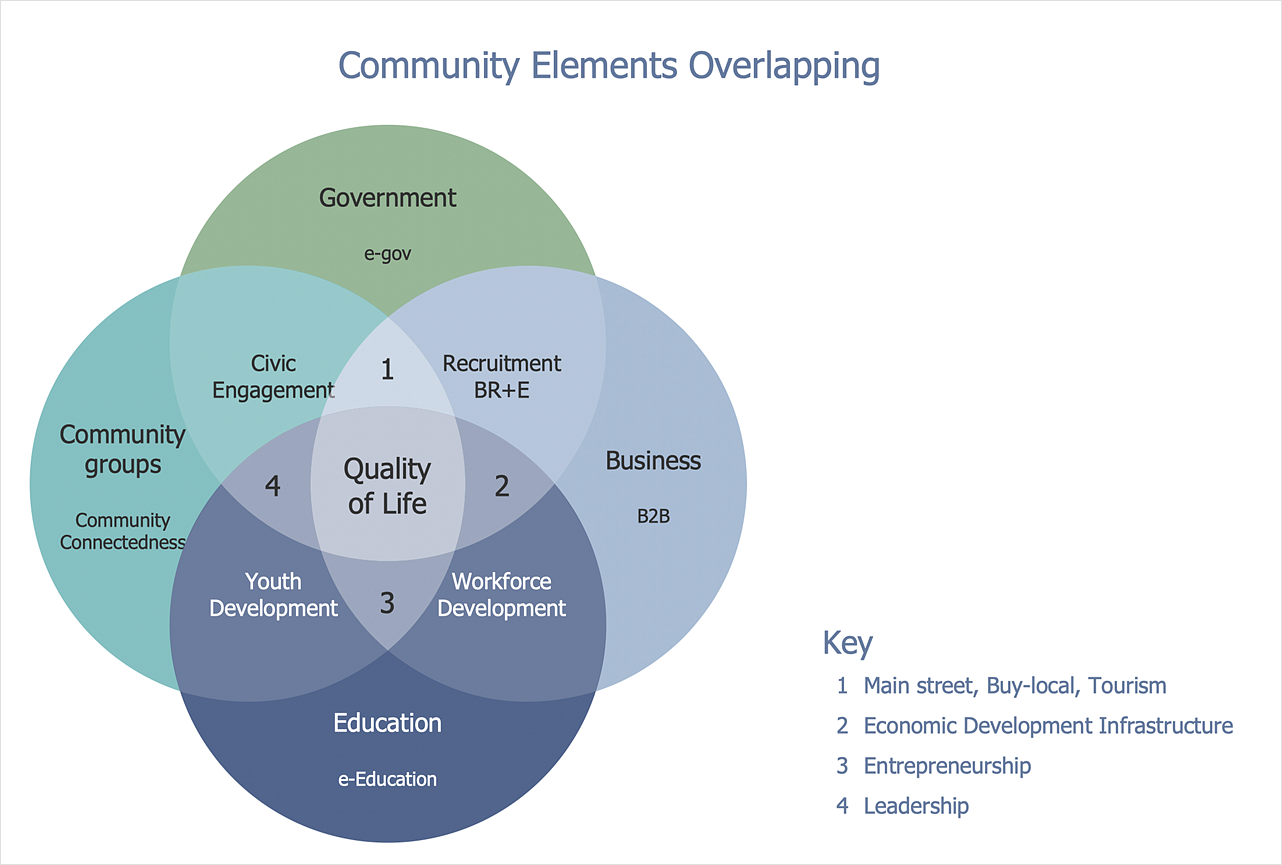
Venn Diagrams are actively used to illustrate simple set relationships in set theory and probability theory, logic and statistics, mathematics and computer science, linguistics, sociology, and marketing. Venn Diagrams are also often used to visually summarize the status and future viability of a project.
Basic Network Diagram
The Basic Network Diagram is an easy and effective way to design and document a simple network, it lets to represent visually and logically how the different network devices and computer equipment can be installed to meet the main business needs. ConceptDraw DIAGRAM software supplied with Computer Network Diagrams solution from the Computer and Networks area of ConceptDraw Solution Park is a perfect tool for drawing the Basic Computer Network diagrams, designs, schematics, and maps, network architectures, topologies, and layouts. Numerous vector libraries of network symbols, icons and components are incredibly helpful for IT and telecom engineers, stakeholders and end-users when designing Basic Network Diagrams, Common Network Diagrams, Common Network Topologies, 10Base-T Star Network Topologies, Bus Topology Diagrams, Communication Network Diagrams, System Designs, Regional Cable Head-End Diagrams, etc. Collection of predesigned samples and templates included to Computer Network Diagrams solution also greatly extends the capabilities of ConceptDraw DIAGRAM users.
HelpDesk
How to Create a Venn Diagram
Venn diagrams were invented by John Venn as a method of depicting relationships between different components. A Venn diagram consists of two or more circles. Each circle represents a specific group or set. The entities which are depicted by circles generally have some common characteristics. A Venn Diagram shows all the possible logical relations between these entities. Any properties that belong to more than one set should be indicated in the sections where the circles overlap. A Venn Diagram can be useful to visually summarize the status and future viability of a project. ConceptDraw DIAGRAM allows you to make Venn diagrams using the Venn Diagrams solution.- Maths Project Diagram
- Project Diagram Math Picture
- Math Project On Calendar Draw On Chart
- How to Draw Physics Diagrams in ConceptDraw PRO | Line Chart ...
- PM Presentations | Line Graphs | Bar Graphs | Agile Project ...
- Online Math Graph Maker
- Mathematical Diagrams Png
- Bar Diagram Math | Basic Diagramming | Basic Flowchart Symbols ...
- Chemistry Related Line Drawing For Project
- Mathematical Diagrams | Basic Diagramming | Mathematics ...
- Physics Diagrams | Physics Symbols | Line Chart Template for Word ...
- Basic Flowchart Symbols and Meaning | Euclidean algorithm ...
- Bar Diagram Math | Basic Diagramming | Mathematical Diagrams ...
- Line Diagram With Specifications To Draw Plan Industrial Building
- Mathematics | Mathematics Symbols | ConceptDraw Solution Park ...
- How to Draw Physics Diagrams in ConceptDraw PRO | Line Chart ...
- Simple & Fast Diagram Software | Mathematical Diagrams | Pyramid ...
- Basic Diagramming | Mathematics | Bar Diagram Math | Example Of ...
- Physics Diagrams | Line Chart Template for Word | How to Draw ...
- Bar Diagram Math | Venn Diagram Examples for Problem Solving ...


