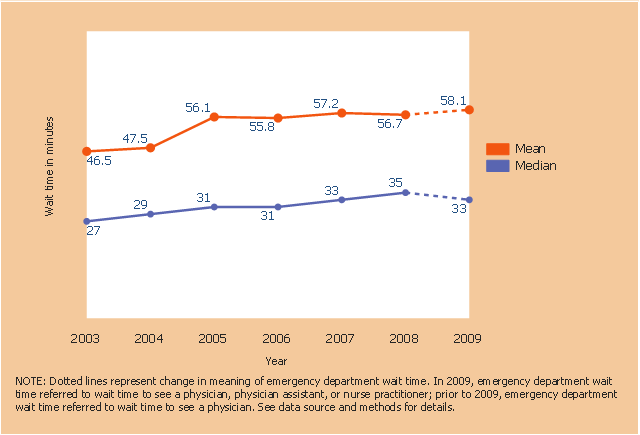
This line graph sample shows the mean and median wait time for treatment in hospital emergency department: United States, 2003–2009. Dotted lines represent change in meaning of emergency department wait time. In 2009, emergency department wait time referred to wait time to see a physician, physician assistant, or nurse practitioner; prior to 2009, emergency department wait time referred to wait time to see a physician.
This line graph was designed on the base of line graph from the website of National Center for Health Statistics, Centers for Disease Control and Prevention (CDC), U.S. Department of Health & Human Services.
[cdc.gov/ nchs/ products/ databriefs/ db102.htm]
The line chart example "Wait time for treatment in hospital emergency departments" was created using the ConceptDraw PRO diagramming and vector drawing software extended with the Line Graphs solution from the Graphs and Charts area of ConceptDraw Solution Park.
 Line Graphs
How to draw a Line Graph with ease? The Line Graphs solution extends the capabilities of ConceptDraw PRO v10 with professionally designed templates, samples, and a library of vector stencils for drawing perfect Line Graphs.
This line graph sample shows the mean and median wait time for treatment in hospital emergency department: United States, 2003–2009. Dotted lines represent change in meaning of emergency department wait time. In 2009, emergency department wait time referred to wait time to see a physician, physician assistant, or nurse practitioner; prior to 2009, emergency department wait time referred to wait time to see a physician.
This line graph was designed on the base of line graph from the website of National Center for Health Statistics, Centers for Disease Control and Prevention (CDC), U.S. Department of Health & Human Services.
[cdc.gov/ nchs/ products/ databriefs/ db102.htm]
The line chart example "Wait time for treatment in hospital emergency departments" was created using the ConceptDraw PRO diagramming and vector drawing software extended with the Line Graphs solution from the Graphs and Charts area of ConceptDraw Solution Park.
This line graph was designed on the base of line graph from the website of National Center for Health Statistics, Centers for Disease Control and Prevention (CDC), U.S. Department of Health & Human Services.
[cdc.gov/ nchs/ products/ databriefs/ db102.htm]
The line chart example "Wait time for treatment in hospital emergency departments" was created using the ConceptDraw PRO diagramming and vector drawing software extended with the Line Graphs solution from the Graphs and Charts area of ConceptDraw Solution Park.
 Plumbing and Piping Plans
Plumbing and Piping Plans solution extends ConceptDraw PRO v10.2.2 software with samples, templates and libraries of pipes, plumbing, and valves design elements for developing of water and plumbing systems, and for drawing Plumbing plan, Piping plan, PVC Pipe plan, PVC Pipe furniture plan, Plumbing layout plan, Plumbing floor plan, Half pipe plans, Pipe bender plans.
 Network Layout Floor Plans
Network Layout Floor Plans solution extends ConceptDraw PRO software functionality with powerful tools for quick and efficient documentation the network equipment and displaying its location on the professionally designed Network Layout Floor Plans. Never before creation of Network Layout Floor Plans, Network Communication Plans, Network Topologies Plans and Network Topology Maps was not so easy, convenient and fast as with predesigned templates, samples, examples and comprehensive set of vector design elements included to the Network Layout Floor Plans solution. All listed types of plans will be a good support for the future correct cabling and installation of network equipment.
- Line Graphs | Wait time for treatment in hospital emergency ...
- Booch OOD Diagram | Emergency Plan | Line Graphs | Hospital E R ...
- Line Graphs | Booch OOD Diagram | Developing Entity Relationship ...
- Line Graphs | Process Flow Chart Examples For Treatment Of Hospital
- Line Graphs | DFD Library System | Seven Management and ...
- High level fault tree | Plumbing and Piping Plans | Line Graphs ...
- Pictures of Graphs | Line Chart Examples | Line Graph | Picture Of A ...
- Line Diagram In Hospital Building
- Line Diagram With Solution Of Hospital Building
- Wait time for treatment in hospital emergency departments | Vector ...
- Line chart
- Pie Chart Examples and Templates
- Structural Chart In Architectural Design In Hospital Management
- Line Diagram Of Hospital
- How to Create a Line Chart | How to Draw a Line Chart Quickly ...
- Department Of Hospital Block Diagram
- Hospital Management Application Flowchart
- Sequence Diagram Of Hospital Management System
- Bubble Diagram For Hospital
- Hospital Disaster Plan Flow Chart Ppt
