ERD Symbols and Meanings
Entity Relationship Diagram (ERD) is a popular software engineering tool for database modeling and illustration the logical structure of databases, which uses one of two notations - Chen's or Crow’s Foot. Crow's foot notation is effective when used in software engineering, information engineering, structured systems analysis and design. Each of these notations applies its own set of ERD symbols. Crow's foot diagrams use boxes to represent entities and lines between these boxes to show relationships. Varied shapes at the ends of lines depict the cardinality of a given relationship. Chen's ERD notation is more detailed way to represent entities and relationships. ConceptDraw PRO application enhanced with all-inclusive Entity-Relationship Diagram (ERD) solution allows design professional ER diagrams with Chen's or Crow’s Foot notation on your choice. It contains the full set of ready-to-use standardized ERD symbols and meanings helpful for quickly drawing, collection of predesigned ERD samples, examples and templates. ConceptDraw Pro is a great alternative to Visio for Mac users as it offers more features and can easily handle the most demanding professional needs.
The vector stencils library "Mac OS X Lion user interface" contains 52 UI design elements.
Use it for designing Mac OS X Lion graphic user interface (GUI) of software for Apple computers in the ConceptDraw PRO diagramming and vector drawing software extended with the Graphic User Interface solution from the Software Development area of ConceptDraw Solution Park.
Use it for designing Mac OS X Lion graphic user interface (GUI) of software for Apple computers in the ConceptDraw PRO diagramming and vector drawing software extended with the Graphic User Interface solution from the Software Development area of ConceptDraw Solution Park.
How to Create a Line Chart
Create a Line Chart with ConceptDraw using our tips. Here you can find an explanation of how to create a line chart quickly.The vector stencils library "Transport map" contains 96 pictograms for drawing transport maps.
Use it in your spatial infographics for visual representation of transport schemes and plans as metro maps in the ConceptDraw PRO diagramming and vector drawing software extended with the Spatial Infographics solution from the area "What is Infographics" of ConceptDraw Solution Park.
Use it in your spatial infographics for visual representation of transport schemes and plans as metro maps in the ConceptDraw PRO diagramming and vector drawing software extended with the Spatial Infographics solution from the area "What is Infographics" of ConceptDraw Solution Park.
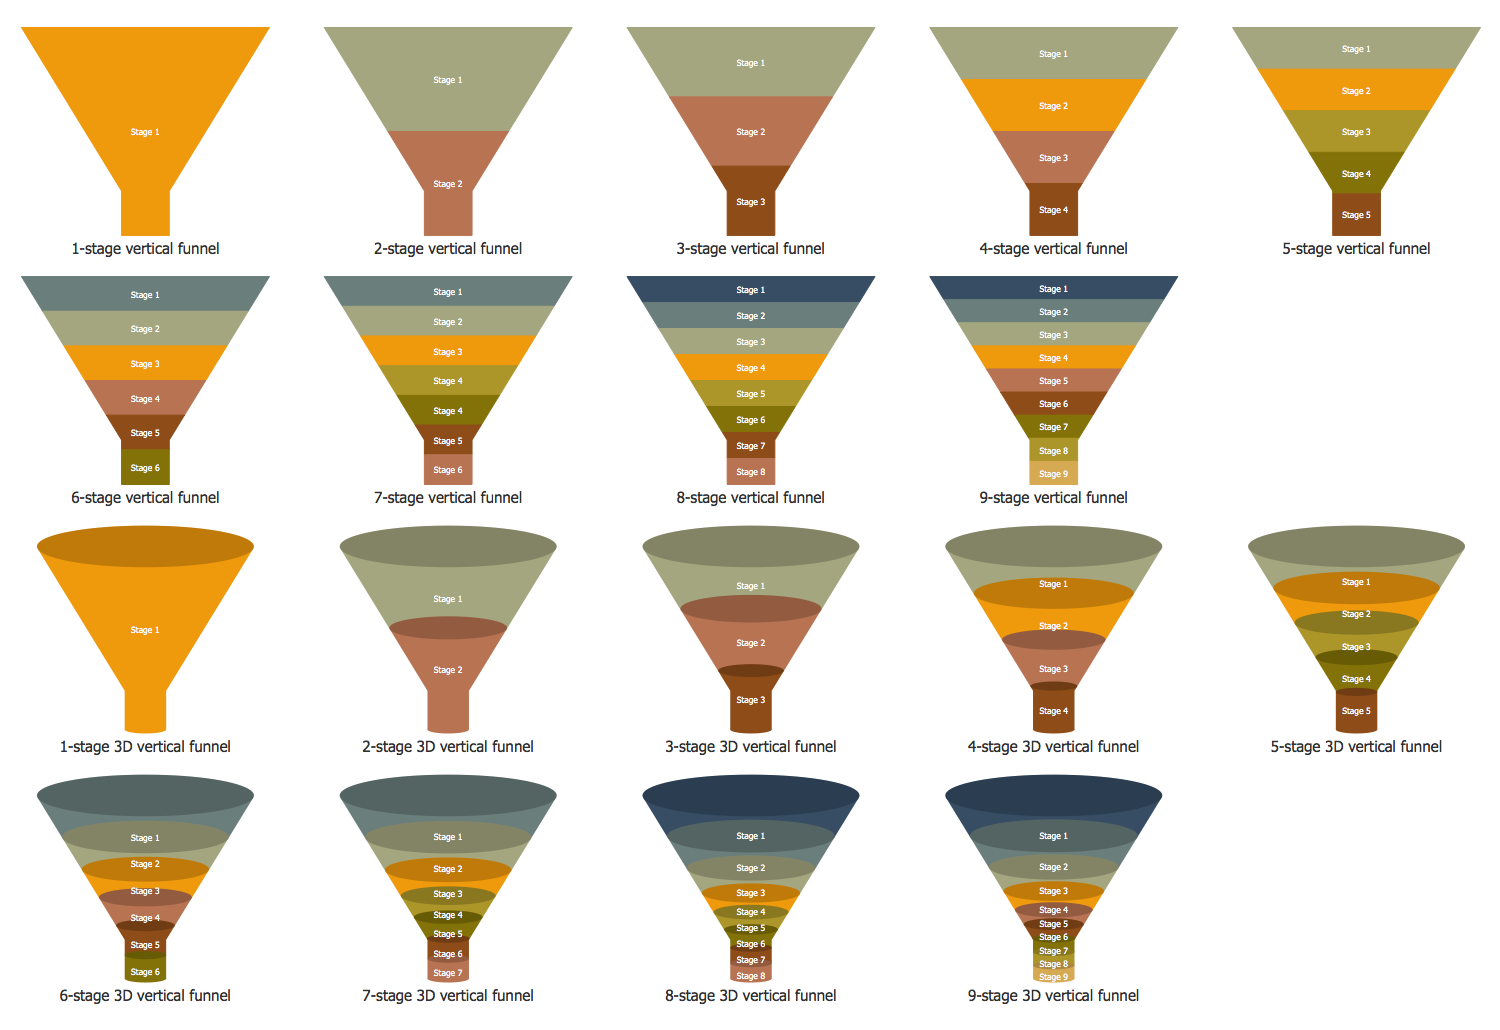
Funnel Diagram
Funnel diagram can be also known as a funnel chart being similar to a stacked percent bar chart. This drawing is a type of chart that can be often used in order to represent the stages in some sales process. It can be also used for showing the amount of potential revenue for each of the described stages.In order to make a funnel diagram, the Funnel Diagrams solution can be used while working in the ConceptDraw PRO diagramming and drawing software. Having the pre-made design elements as well as the examples of funnel diagrams, the Funnel Diagrams solution allows any ConceptDraw PRO user to make their own unique as well as professionally-looking drawings.
Chart Templates
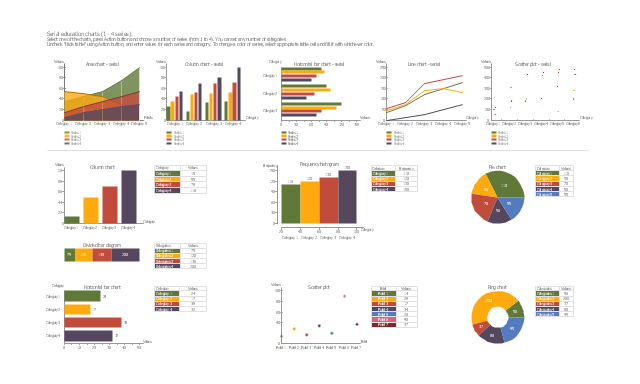
Easy charting software comes with beautiful chart templates and examples. This makes it easy to create professional charts without prior experience.The vector stencils library "Education charts" contains 12 graphs and charts: area chart, column chart, divided bar diagram, histogram, horizontal bar graph, line graph, pie chart, ring chart, scatter plot.
Use it to create your educational infograms.
"A chart can take a large variety of forms, however there are common features that provide the chart with its ability to extract meaning from data.
Typically the data in a chart is represented graphically, since humans are generally able to infer meaning from pictures quicker than from text. Text is generally used only to annotate the data.
One of the more important uses of text in a graph is the title. A graph's title usually appears above the main graphic and provides a succinct description of what the data in the graph refers to.
Dimensions in the data are often displayed on axes. If a horizontal and a vertical axis are used, they are usually referred to as the x-axis and y-axis respectively. Each axis will have a scale, denoted by periodic graduations and usually accompanied by numerical or categorical indications. Each axis will typically also have a label displayed outside or beside it, briefly describing the dimension represented. If the scale is numerical, the label will often be suffixed with the unit of that scale in parentheses. ...
The data of a chart can appear in all manner of formats, and may include individual textual labels describing the datum associated with the indicated position in the chart. The data may appear as dots or shapes, connected or unconnected, and in any combination of colors and patterns. Inferences or points of interest can be overlaid directly on the graph to further aid information extraction.
When the data appearing in a chart contains multiple variables, the chart may include a legend (also known as a key). A legend contains a list of the variables appearing in the chart and an example of their appearance. This information allows the data from each variable to be identified in the chart." [Chart. Wikipedia]
The shapes example "Design elements - Education charts" was created using the ConceptDraw PRO diagramming and vector drawing software extended with the Education Infographics solition from the area "Business Infographics" in ConceptDraw Solution Park.
"A football pitch (also known as a football field or soccer field) is the playing surface for the game of football made of turf. Its dimensions and markings are defined by Law 1 of the Laws of the Game, "The Field of Play".
All line markings on the pitch form part of the area which they define. For example, a ball on or above the touchline is still on the field of play; a ball on the line of the goal area is in the goal area; and a foul committed over the 16.5-metre (18-yard) line has occurred in the penalty area. Therefore a ball must completely cross the touchline to be out of play, and a ball must wholly cross the goal line (between the goal posts) before a goal is scored; if any part of the ball is still on or above the line, the ball is still in play.
The field descriptions that apply to adult matches are described below. Note that due to the original formulation of the Laws in England and the early supremacy of the four British football associations within IFAB, the standard dimensions of a football pitch were originally expressed in imperial units. The Laws now express dimensions with approximate metric equivalents (followed by traditional units in brackets), but use of the imperial units remains common in some countries, especially in the United Kingdom." [Association football pitch. Wikipedia]
The template "Vertical association football pitch" for the ConceptDraw PRO diagramming and vector drawing software is included in the Soccer solution from the Sport area of ConceptDraw Solution Park.
www.conceptdraw.com/ solution-park/ sport-soccer
HelpDesk
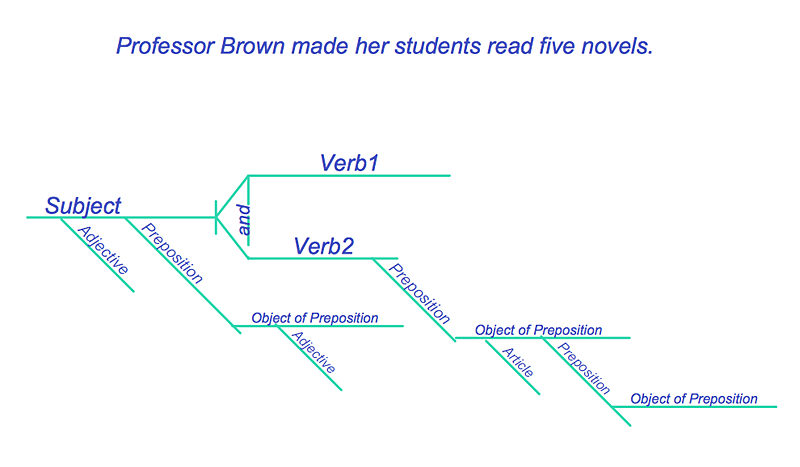
How to Diagram Sentences in ConceptDraw PRO
Diagramming sentences is a playful, fun way to learning English Grammer. Sentences can be very complex, and can contain many different parts of speech which implicate many different grammatical rules. Diagramming sentences will help you to make sure every parts of your sentence are grammatically correct, and provides you with more comprehensive understanding of the English Language. A Sentence Diagram displays the parts of a sentence as a diagram in order to show the relationship of words and groups of words within the sentence. Sentence Diagram shows the relationship between the proposal of its parts. This is a good way to teach grammar! Sentence Diagram helps to make the writing more coherent as well as more interesting to read. ConceptDraw PRO allows you to create clear sentence diagrams using the special templates and vector stencils library."The goal line is the chalked or painted line dividing the end zone from the field of play in American football and Canadian football. It is the line that must be crossed in order to score a touchdown
If any part of the ball reaches any part of the imaginary vertical plane transected by this line while in-bounds and in possession of a player whose team is striving toward that end of the field, this is considered a touchdown and scores six points for the team whose player has advanced the ball to, or recovered the ball in, this position. This is in contrast with other sports like Association football and ice hockey, which require the puck or ball to pass completely over the goal line to count as a score.
If any member of the offensive team is downed while in possession of the ball behind his own team's goal line, this is called a safety and scores two points for the defensive team.
If, during the course of play, a loose ball travels past the goal line and is recovered within the end zone, then it is a touchdown if recovered by the kicking team, or a touchback if recovered and downed by the receiving team.
In the event of a kick recovered in one's own end zone, the entirety of the ball must pass the goal line in order for the ball to be considered in the field of play, and not a touchback." [Goal line (gridiron football). Wikipedia]
The American football positions diagram example "Goal line formation (Offense/ Defense)" was created using the ConceptDraw PRO diagramming and vector drawing software extended with the Football solution from the Sport area of ConceptDraw Solution Park.
- How to Diagram Sentences in ConceptDraw PRO | Vertical Line ...
- Cross-Functional Flowcharts | Vertical White Line Transparent Png
- Separator Line Image In Png
- Mac OS X Lion user interface - Vector stencils library
- White Line Vertical Png
- Transparent Background Vertical Scroll Bar
- In Flowchart A Circle With A Vertical Line Drawn Is Symbol Used To
- Vertical Straight Line Png
- Vertical Line Chart
- Line Separator Image Vertical


-mac-os-x-lion-user-interface---vector-stencils-library.png--diagram-flowchart-example.png)


-mac-os-x-lion-user-interface---vector-stencils-library.png--diagram-flowchart-example.png)
-mac-os-x-lion-user-interface---vector-stencils-library.png--diagram-flowchart-example.png)
-mac-os-x-lion-user-interface---vector-stencils-library.png--diagram-flowchart-example.png)
-(inactive)-mac-os-x-lion-user-interface---vector-stencils-library.png--diagram-flowchart-example.png)


-mac-os-x-lion-user-interface---vector-stencils-library.png--diagram-flowchart-example.png)
-mac-os-x-lion-user-interface---vector-stencils-library.png--diagram-flowchart-example.png)


-mac-os-x-lion-user-interface---vector-stencils-library.png--diagram-flowchart-example.png)
-mac-os-x-lion-user-interface---vector-stencils-library.png--diagram-flowchart-example.png)






















































.png--diagram-flowchart-example.png)