HelpDesk
How to Set Line Jumps for Smart Connectors in ConceptDraw DIAGRAM
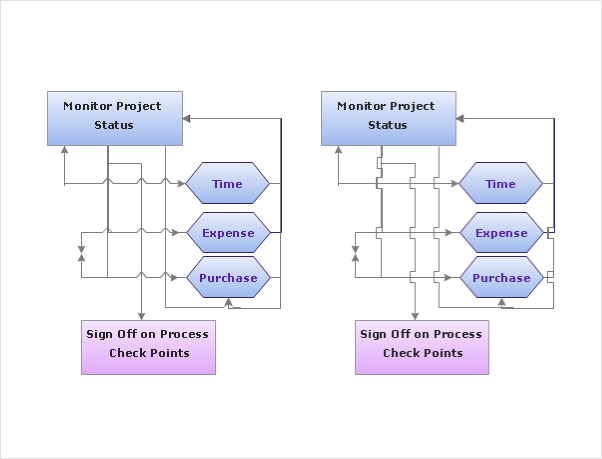
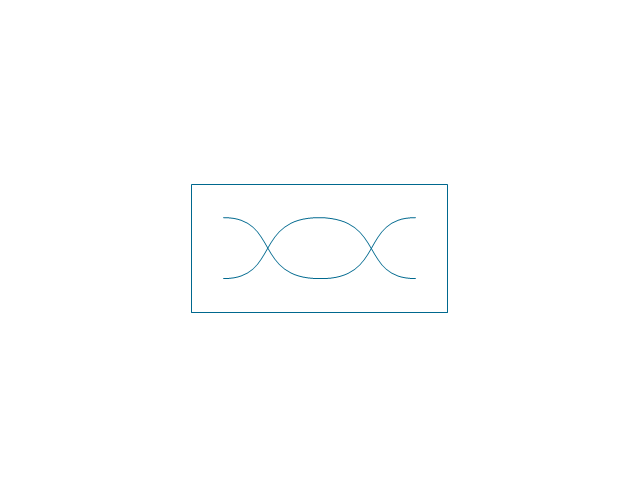
Connecting objects in ConceptDraw DIAGRAM is an easy task. You can use Chain, or Tree connection mode for automatic connection of multiple objects. Besides the automatic connection modes, ConceptDraw DIAGRAM offers few options to connect objects manually: Direct, Arc, Bezier, Smart, Curve and Round Connectors. You can make them square, arched or angled and also set vertical or horizontal orientation Thus, you can control how the jumps and orientation occurs on smart connectors. When two smart connectors cross each other you can control how the two intersecting lines look.ERD Symbols and Meanings
Entity Relationship Diagram (ERD) is a popular software engineering tool for database modeling and illustration the logical structure of databases, which uses one of two notations - Chen's or Crow’s Foot. Crow's foot notation is effective when used in software engineering, information engineering, structured systems analysis and design. Each of these notations applies its own set of ERD symbols. Crow's foot diagrams use boxes to represent entities and lines between these boxes to show relationships. Varied shapes at the ends of lines depict the cardinality of a given relationship. Chen's ERD notation is more detailed way to represent entities and relationships. ConceptDraw DIAGRAM application enhanced with all-inclusive Entity-Relationship Diagram (ERD) solution allows design professional ER diagrams with Chen's or Crow’s Foot notation on your choice. It contains the full set of ready-to-use standardized ERD symbols and meanings helpful for quickly drawing, collection of predesigned ERD samples, examples and templates. ConceptDraw Pro is a great alternative to Visio for Mac users as it offers more features and can easily handle the most demanding professional needs.
HelpDesk
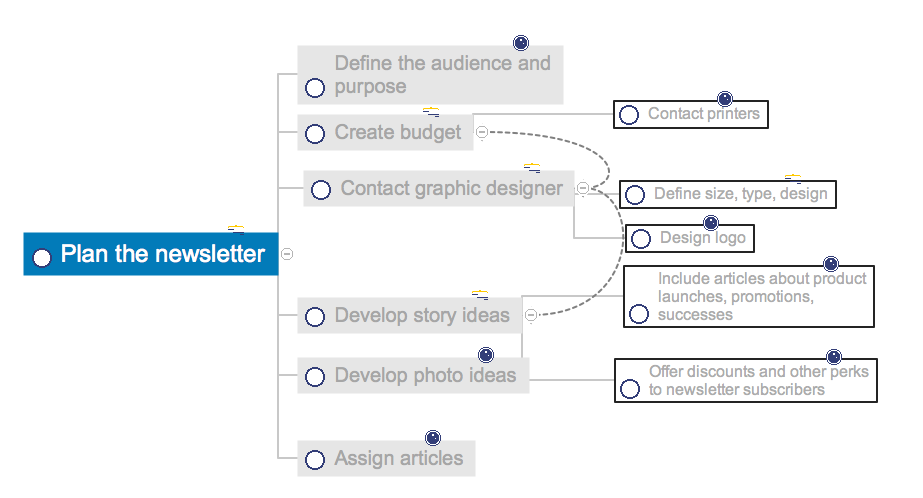
How to Change the Form and Color of a Topic’s Line in Your Mind Map
You can completely customize the style of your mind maps, including the style of topic lines and outlines. This article describes how to change the form and color of a topic’s line in your mind map.Electrical Symbols — Lamps, Acoustics, Readouts
Wiring and circuit diagrams use special symbols recognized by everyone who uses the drawings. The symbols on the drawings show how components like resistors, capacitors, inductors, switches, lamps, acoustic devices, measuring devices and other electrical and electronic components are connected together. 26 libraries of the Electrical Engineering Solution of ConceptDraw DIAGRAM make your electrical diagramming simple, efficient, and effective. You can simply and quickly drop the ready-to-use objects from libraries into your document to create the electrical diagram.Electrical Symbols — Composite Assemblies
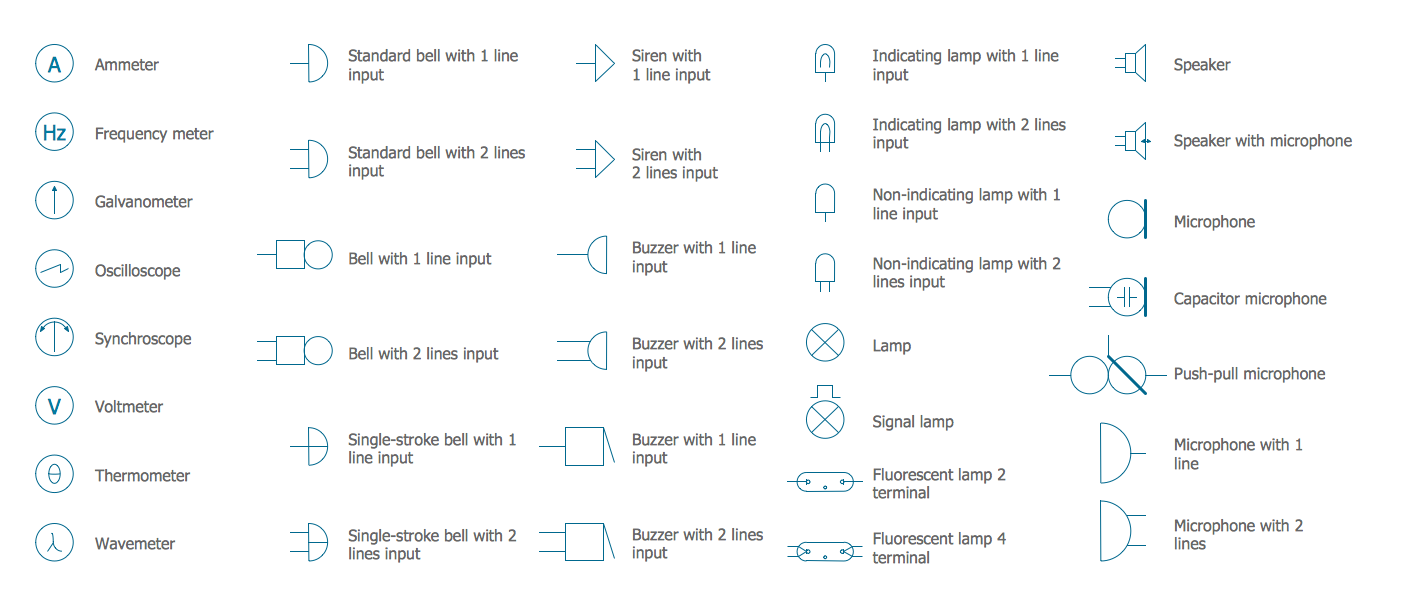
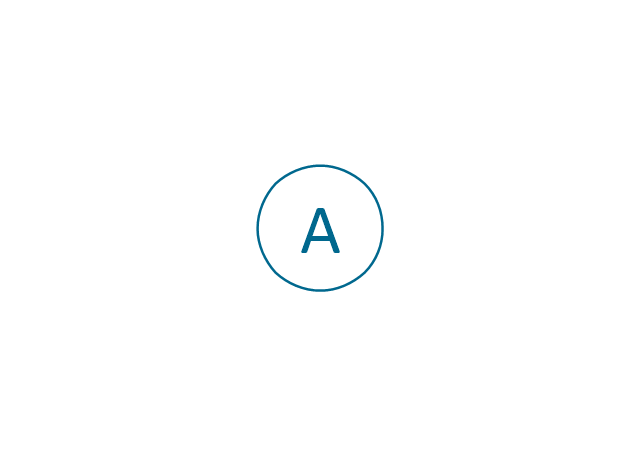
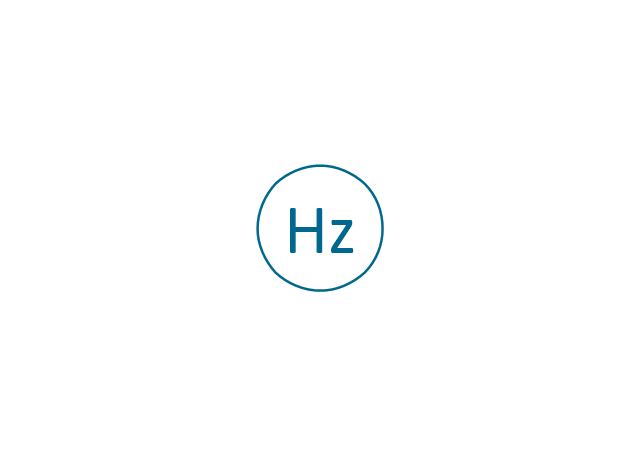
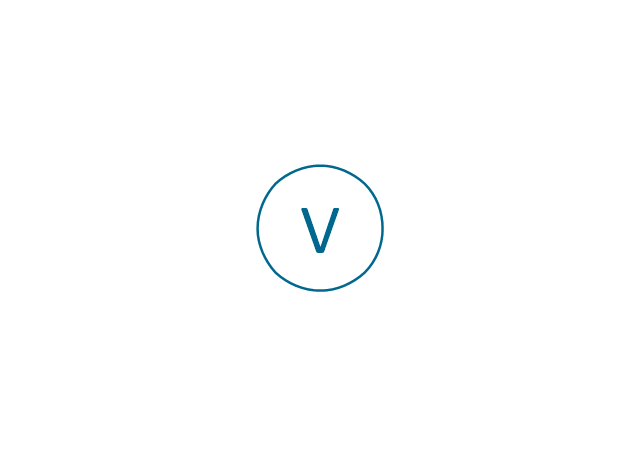
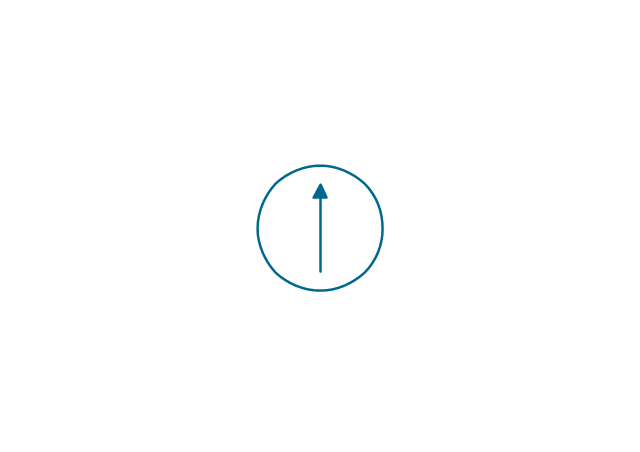
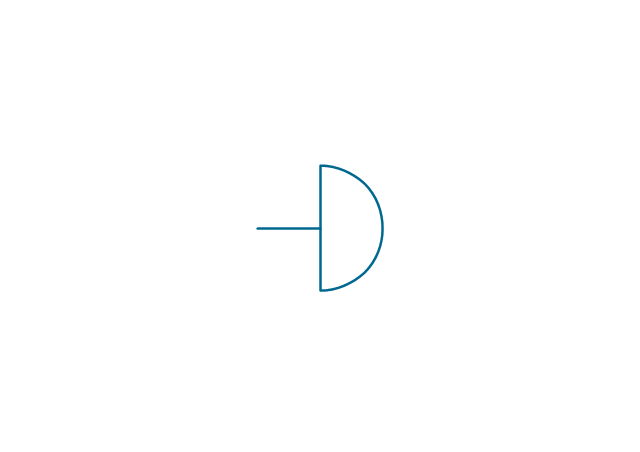
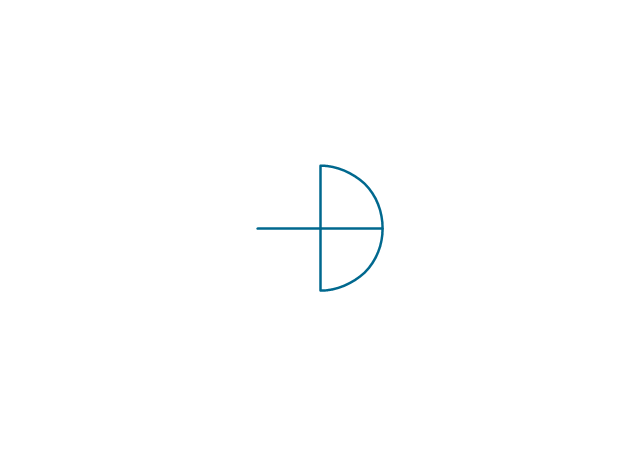
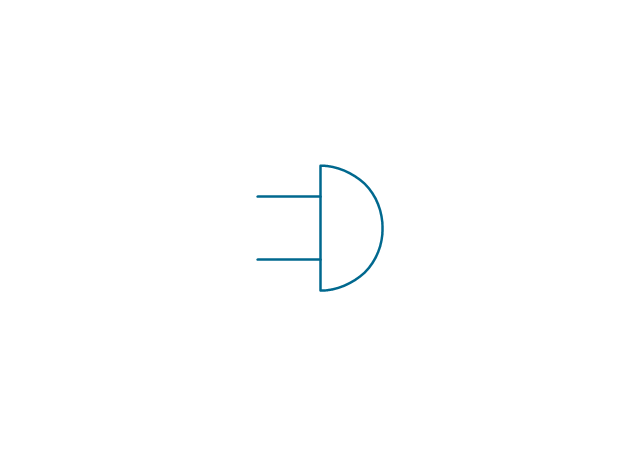
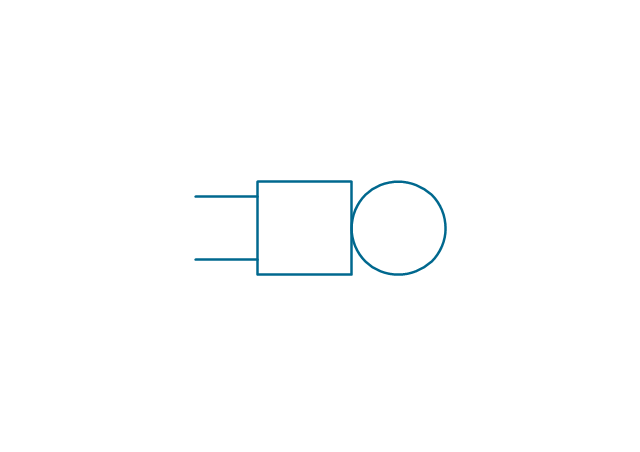
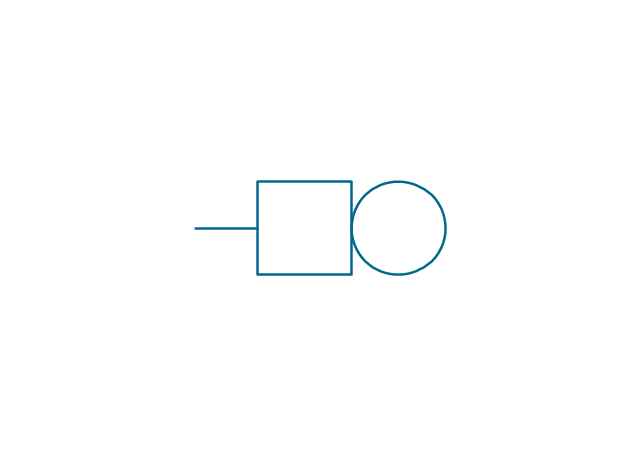
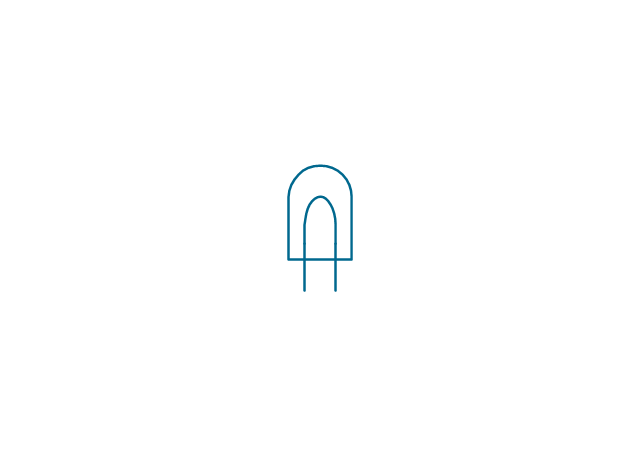
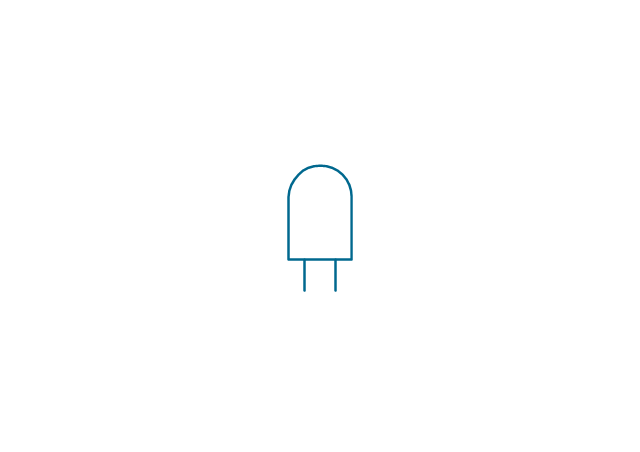
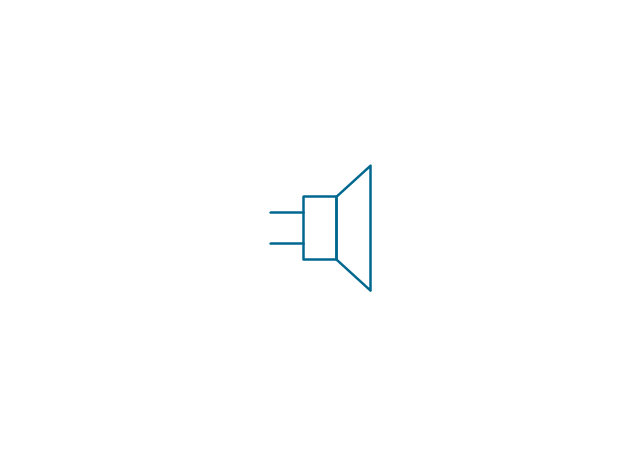
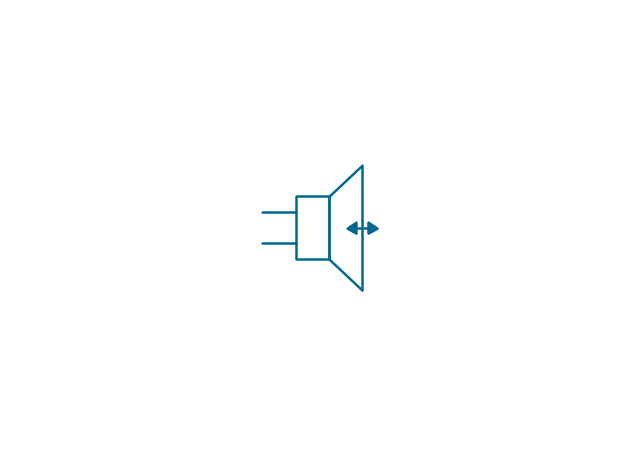
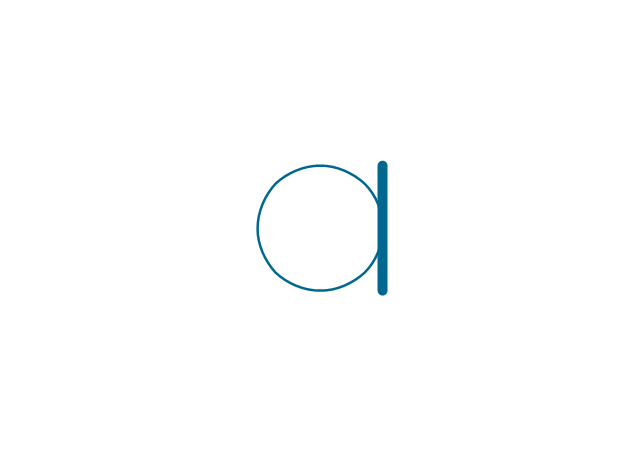
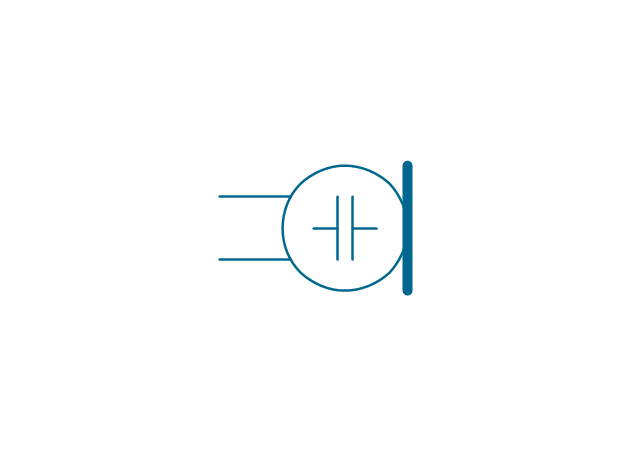
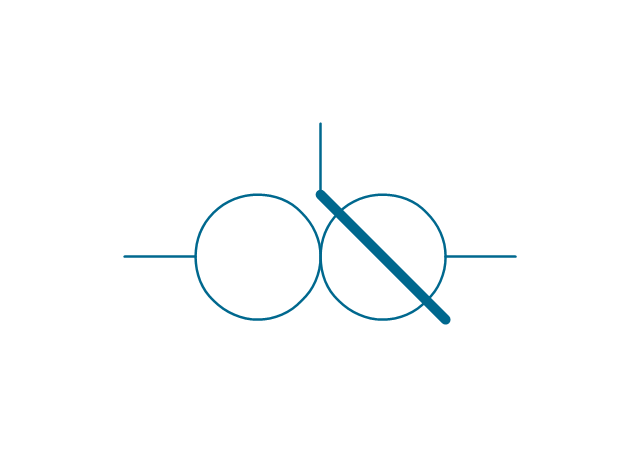
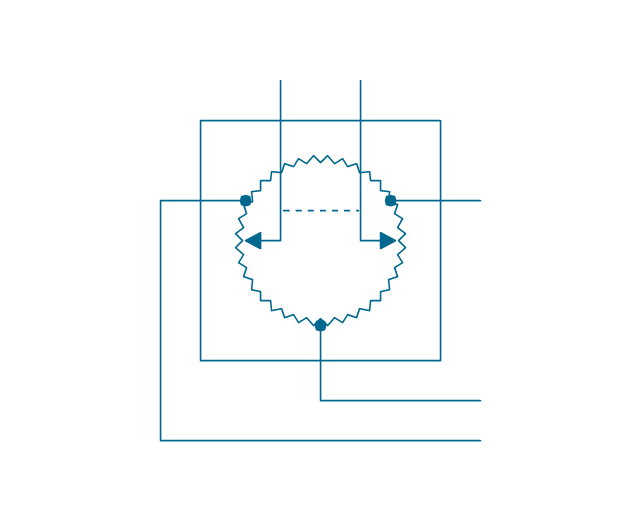
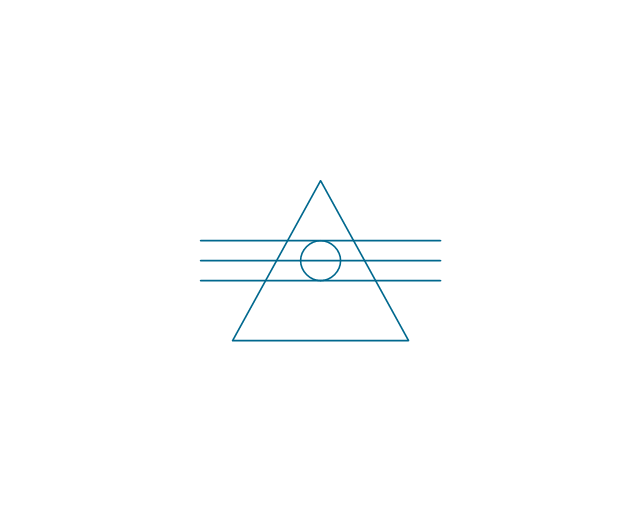
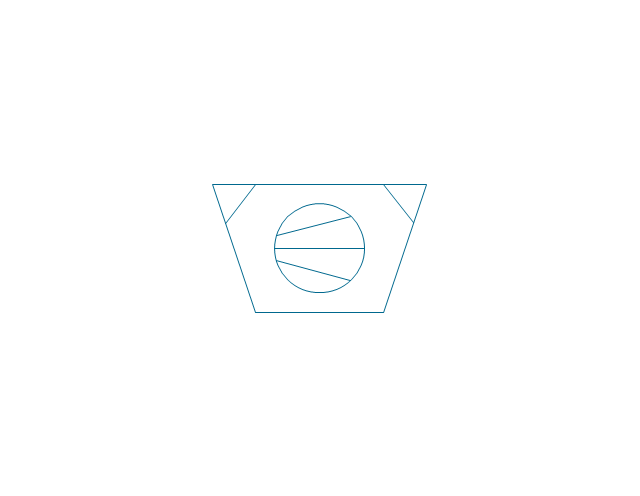
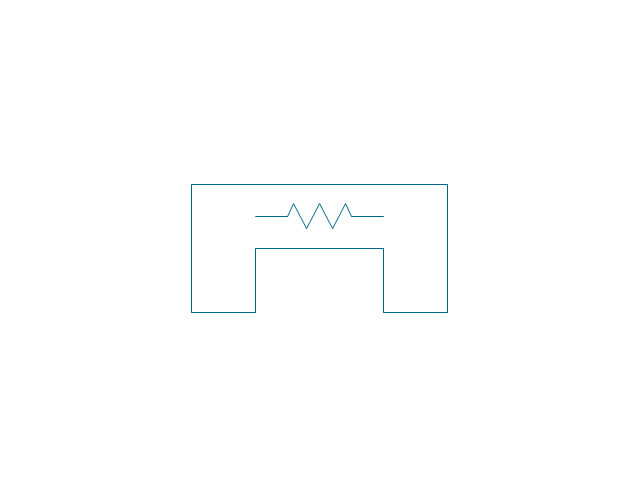
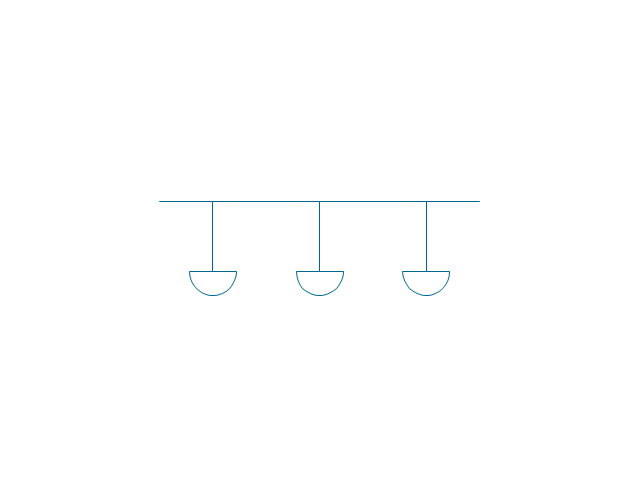
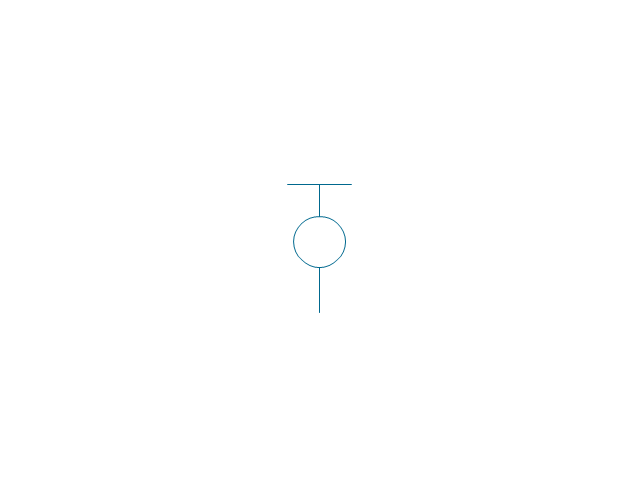
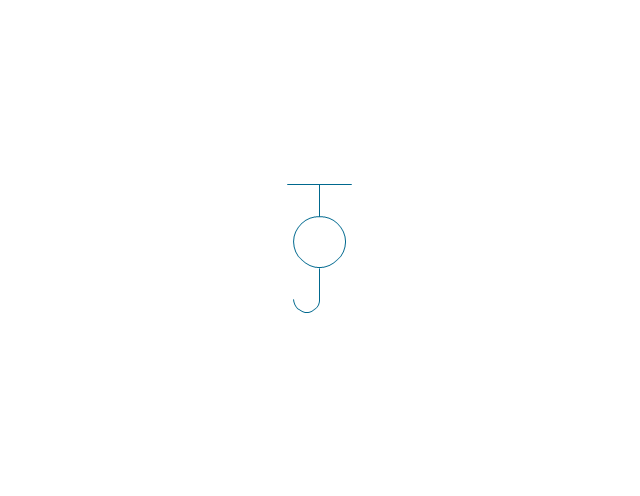
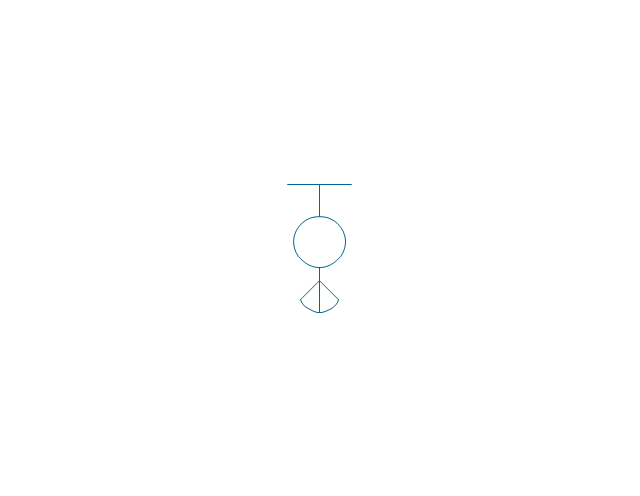
Electronic components have two or more electrical terminals (or leads) aside from antennas which may only have one terminal. These leads connect to create an electronic circuit with a particular function (for example an amplifier, radio receiver, or oscillator). Basic electronic components may be packaged discretely, as arrays or networks of like components, or integrated inside of packages such as semiconductor integrated circuits, hybrid integrated circuits, or thick film devices. 26 libraries of the Electrical Engineering Solution of ConceptDraw DIAGRAM make your electrical diagramming simple, efficient, and effective. You can simply and quickly drop the ready-to-use objects from libraries into your document to create the electrical diagram.The vector stencils library "Lamps, acoustics, measuring instruments" contains 35 element symbols of lamps, acoustic components, electrical measuring instruments.
Use these shapes for drawing electrical schematics and electronic circuit diagrams in the ConceptDraw PRO diagramming and vector drawing software extended with the Electrical Engineering solution from the Engineering area of ConceptDraw Solution Park.
www.conceptdraw.com/ solution-park/ engineering-electrical
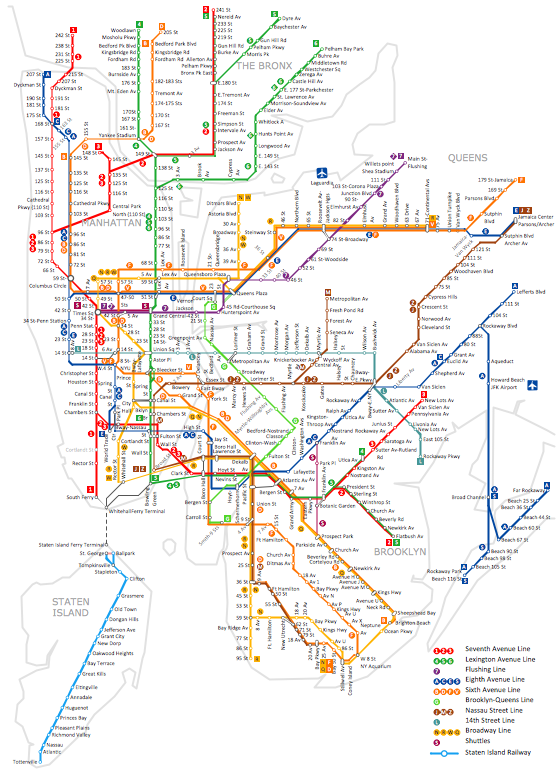
Infographic software: the sample of New York City Subway map
Tool to draw Metro Map styled inforgraphics. New York City Subway map sample.Ice Hockey Rink Dimensions
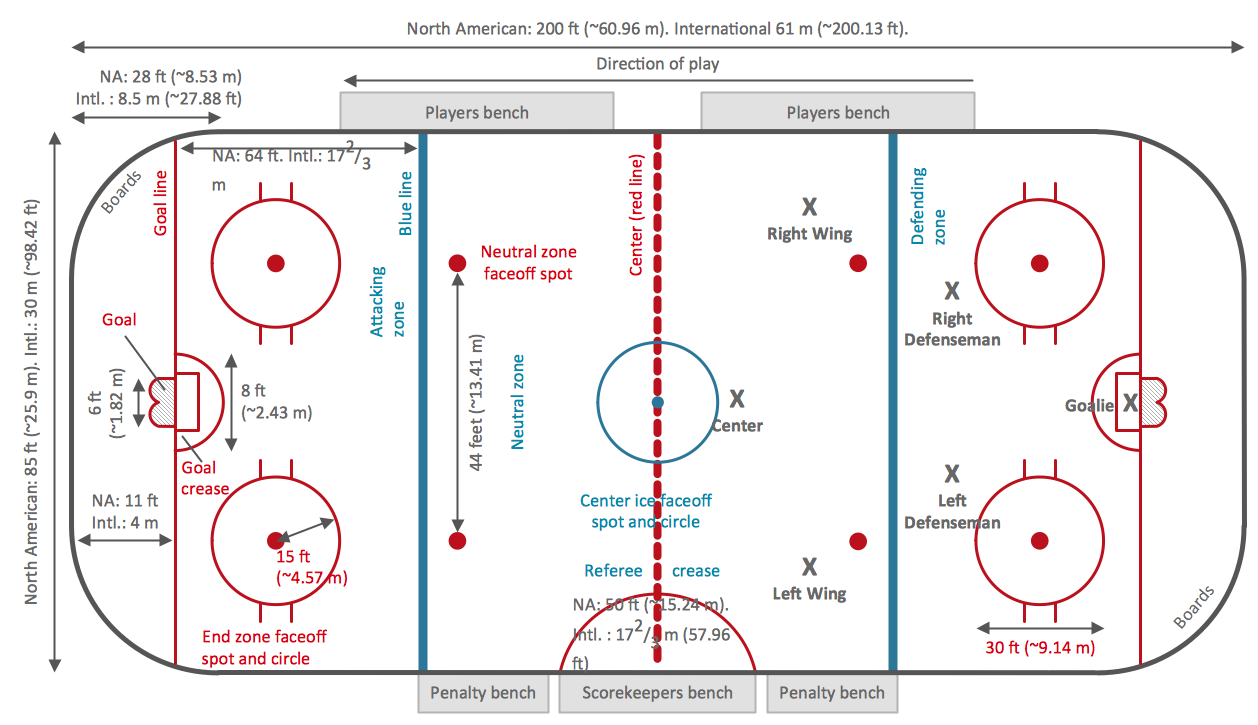
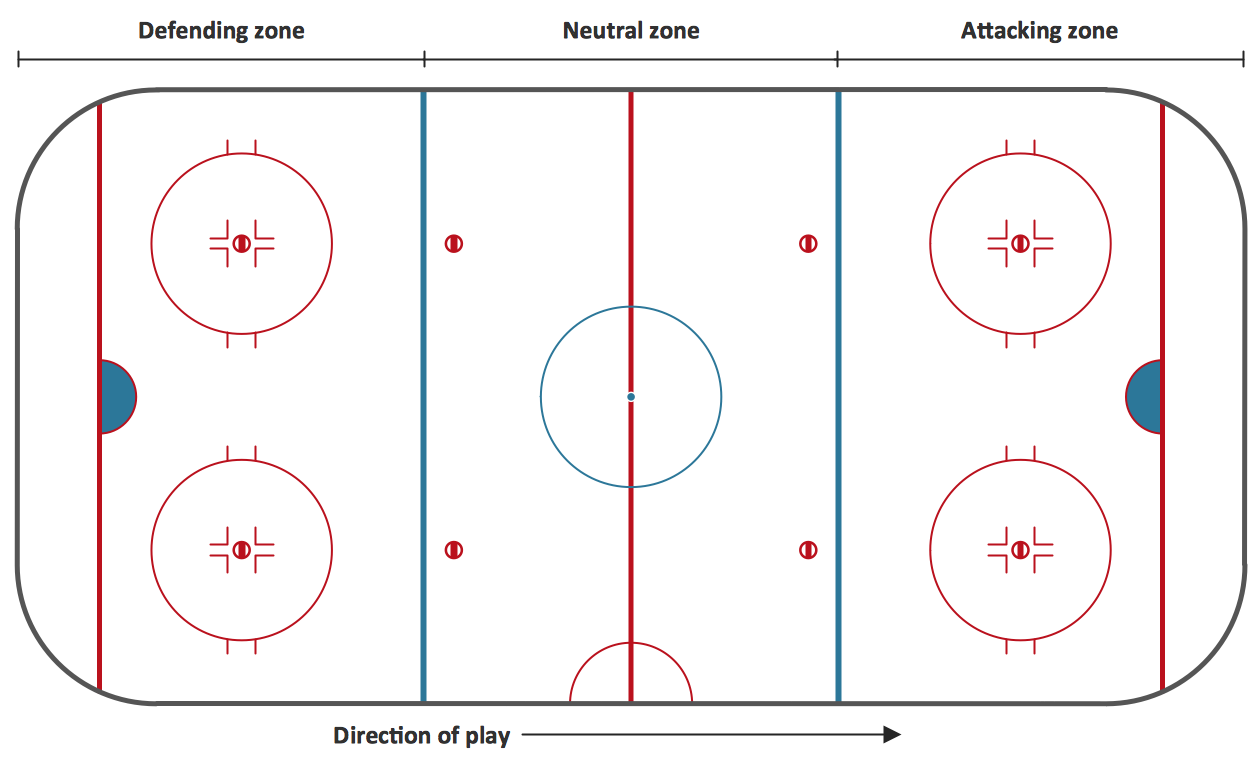
Meeting ice hockey rules one should learn ice hockey rink terms, lines, zones etc. ConceptDraw DIAGRAM is an advanced drawing software that allows you produce ice hockey rink depiction of any complexity, from simple sketch drawing to detailed one as on example below.HelpDesk
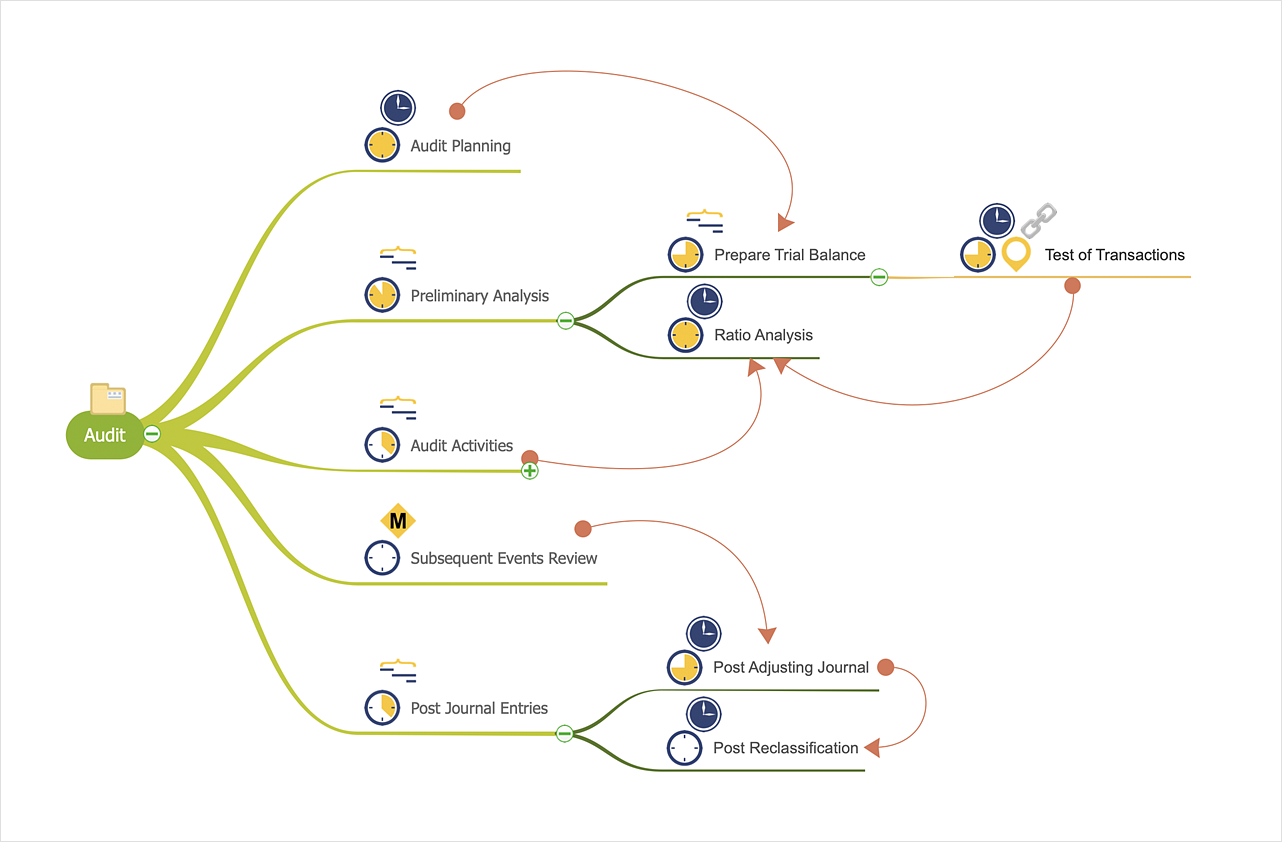
How to Show the Relationship Between Topics
Any mind map contains topics that are arranged in a radial structure. It depicts the relation (semantic, causal, association, etc.) between the concepts, parts, and components of the main idea. In addition to the main connections that make the structure of a mind map, topics can be linked with other lines. ConceptDraw MINDMAP allows you to show the relationships between topics, which belong to different parts of the mind map structure, but also influence each other. Relationships help to show and organize complex interconnections between topics of mind map visually. Such communication is also very important - the mind map, where many topics are not related, tends to turn into a common text!The vector stencils library "Lamps, acoustics, measuring instruments" contains 35 element symbols of lamps, acoustic components, electrical measuring instruments.
Use these shapes for drawing electrical schematics and electronic circuit diagrams in the ConceptDraw PRO diagramming and vector drawing software extended with the Electrical Engineering solution from the Engineering area of ConceptDraw Solution Park.
www.conceptdraw.com/ solution-park/ engineering-electrical
"A chart can take a large variety of forms, however there are common features that provide the chart with its ability to extract meaning from data.
Typically the data in a chart is represented graphically, since humans are generally able to infer meaning from pictures quicker than from text. Text is generally used only to annotate the data.
One of the more important uses of text in a graph is the title. A graph's title usually appears above the main graphic and provides a succinct description of what the data in the graph refers to.
Dimensions in the data are often displayed on axes. If a horizontal and a vertical axis are used, they are usually referred to as the x-axis and y-axis respectively. Each axis will have a scale, denoted by periodic graduations and usually accompanied by numerical or categorical indications. Each axis will typically also have a label displayed outside or beside it, briefly describing the dimension represented. If the scale is numerical, the label will often be suffixed with the unit of that scale in parentheses. ...
Within the graph a grid of lines may appear to aid in the visual alignment of data. The grid can be enhanced by visually emphasizing the lines at regular or significant graduations. The emphasized lines are then called major grid lines and the remainder are minor grid lines.
The data of a chart can appear in all manner of formats, and may include individual textual labels describing the datum associated with the indicated position in the chart. The data may appear as dots or shapes, connected or unconnected, and in any combination of colors and patterns. Inferences or points of interest can be overlaid directly on the graph to further aid information extraction.
When the data appearing in a chart contains multiple variables, the chart may include a legend (also known as a key). A legend contains a list of the variables appearing in the chart and an example of their appearance. This information allows the data from each variable to be identified in the chart." [Chart. Wikipedia]
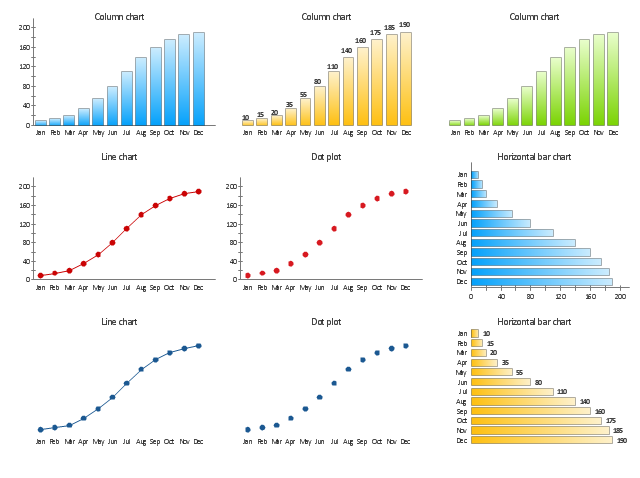
The vector stencils library "Time series charts" contains 10 templates: 3 column charts, 3 bar charts, 2 line graphs and 2 dot plots. All these charts are Live Objects displaying the data from external data source files.
Use these chart templates to design your business performance digital dashboards using the ConceptDraw PRO diagramming and vector drawing software.
The example "Design elements - Time series charts" is included in the Time Series Dashboard solution from the area "What is a Dashboard" of ConceptDraw Solution Park.
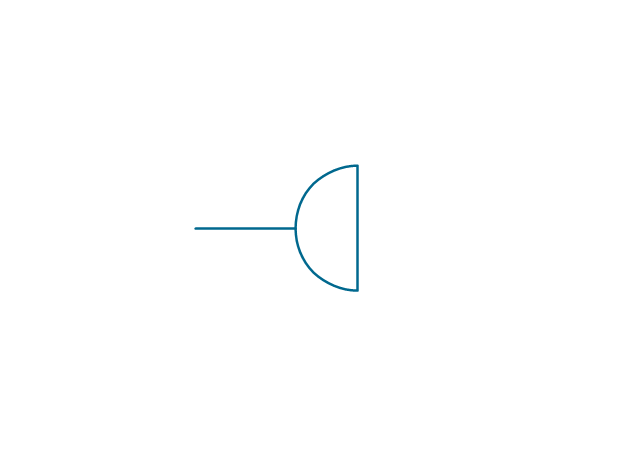
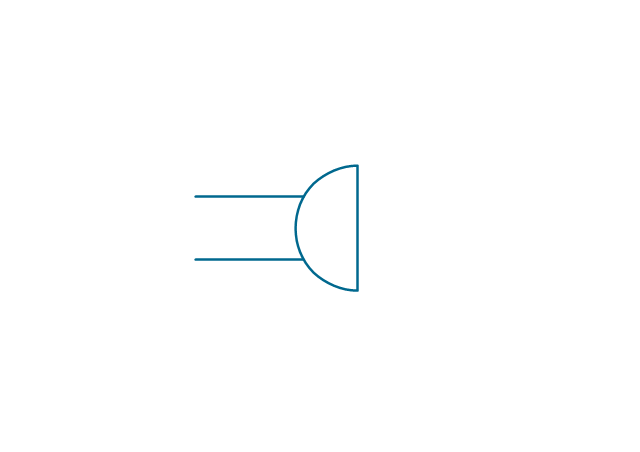
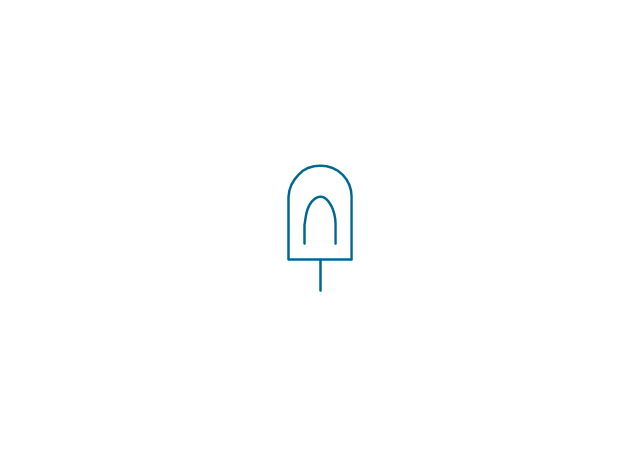
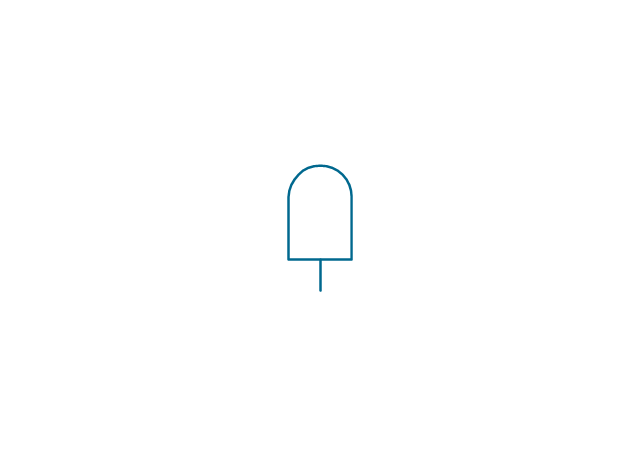
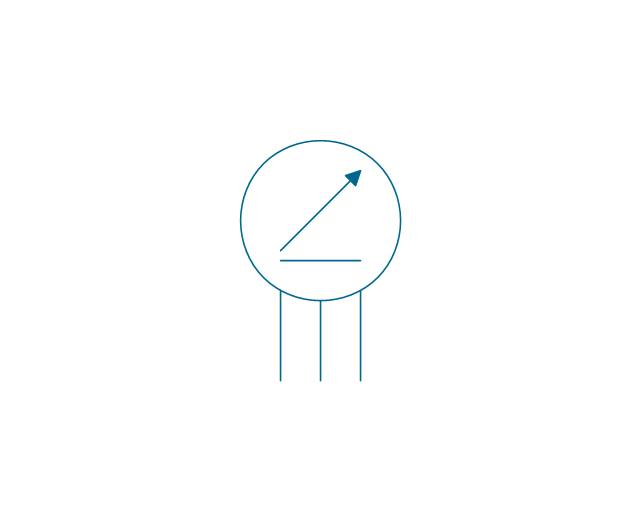
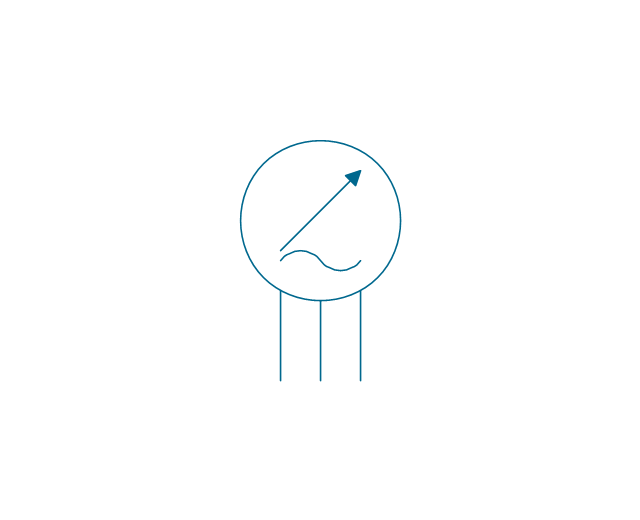
The vector stencils library "Lamps, acoustics, measuring instruments" contains 35 element symbols of lamps, acoustic components, electrical measuring instruments.
Use these shapes for drawing electrical schematics and electronic circuit diagrams in the ConceptDraw PRO diagramming and vector drawing software extended with the Electrical Engineering solution from the Engineering area of ConceptDraw Solution Park.
www.conceptdraw.com/ solution-park/ engineering-electrical
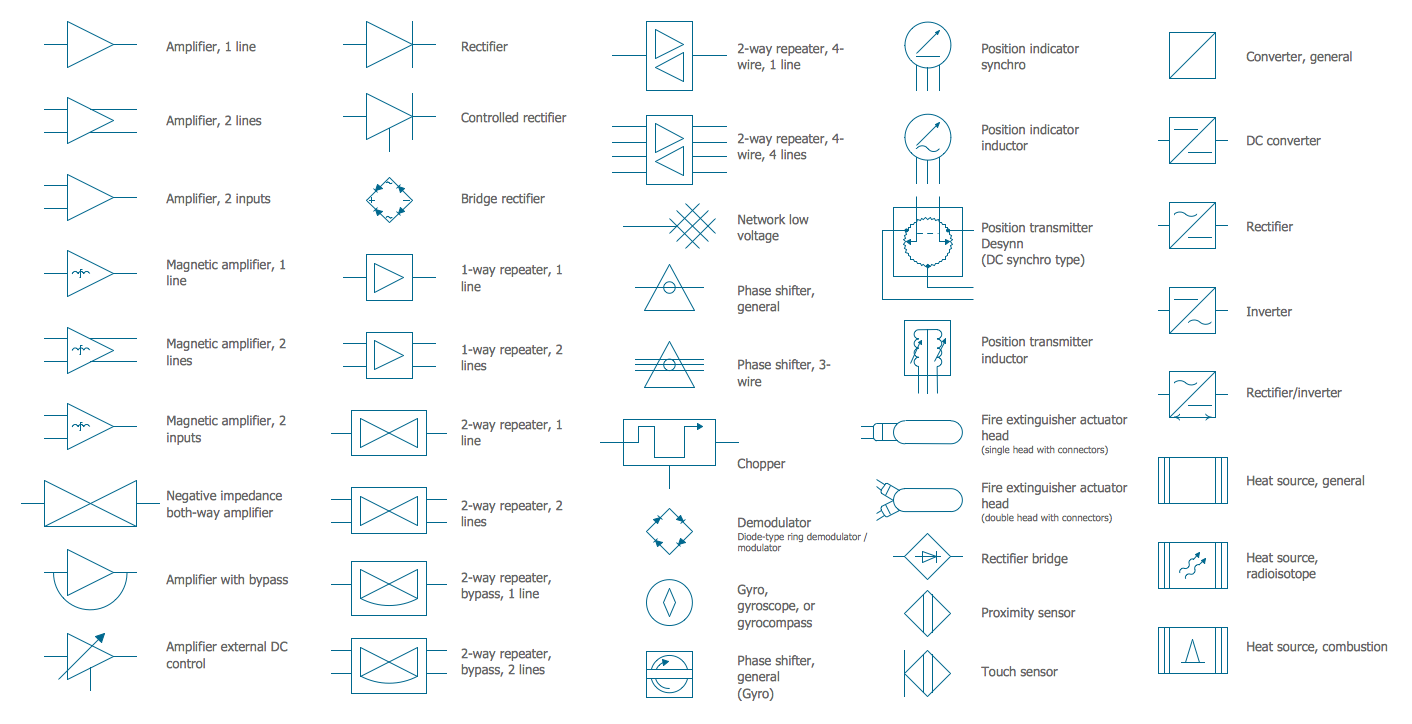
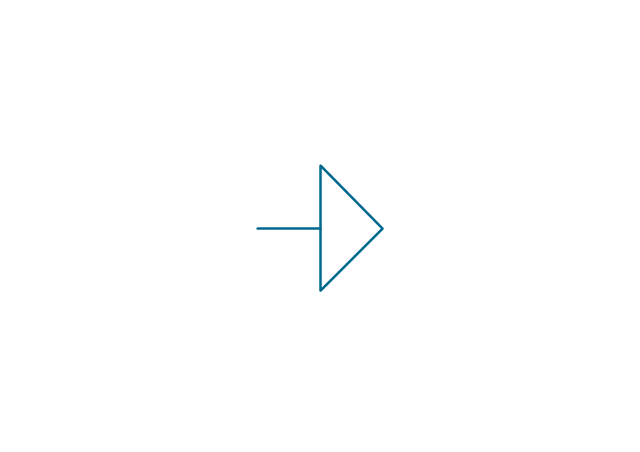
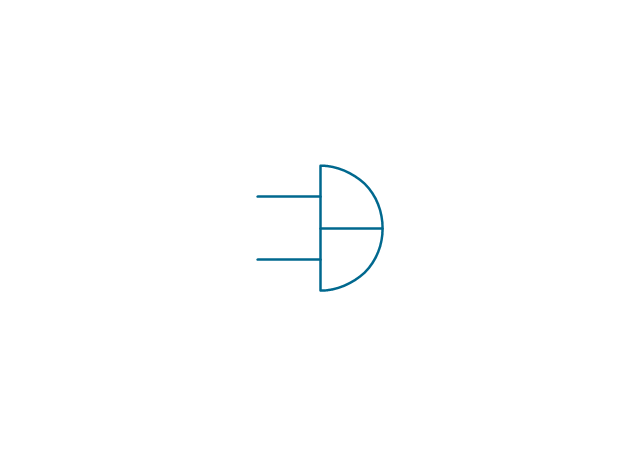
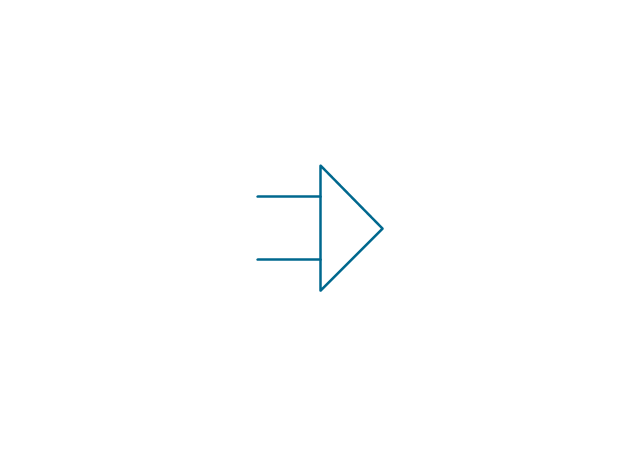
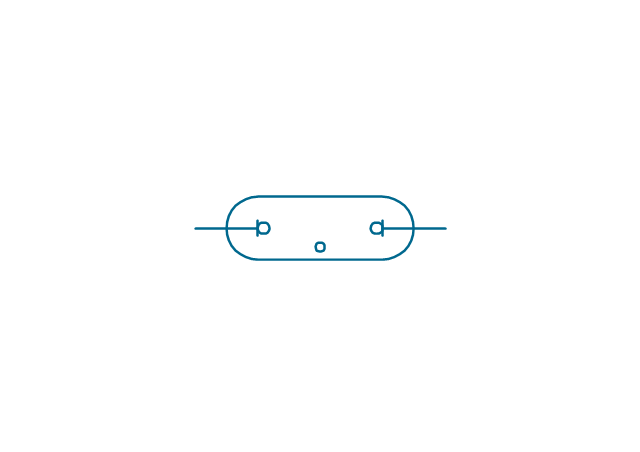
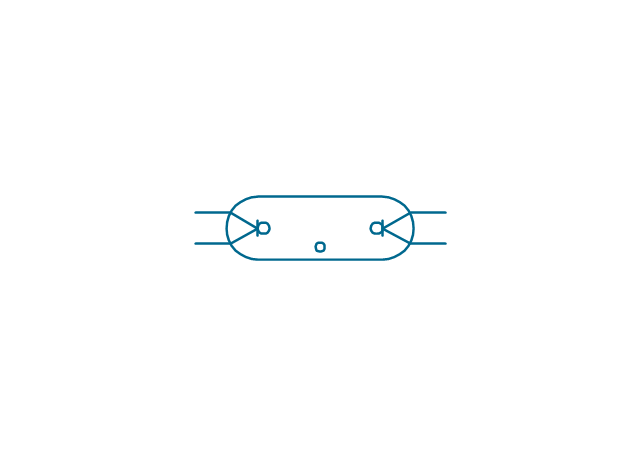
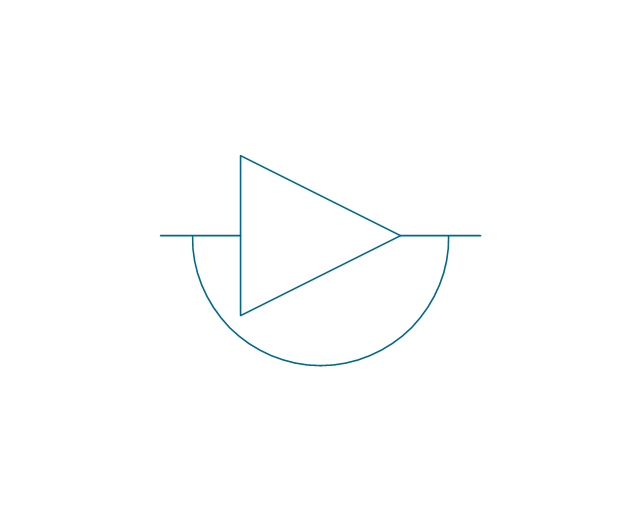
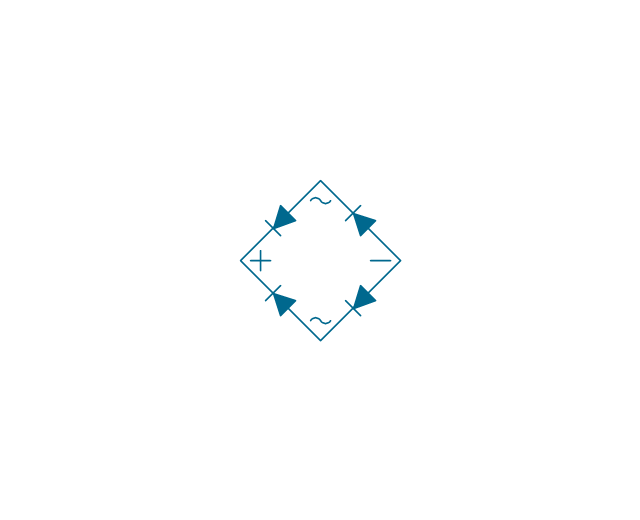
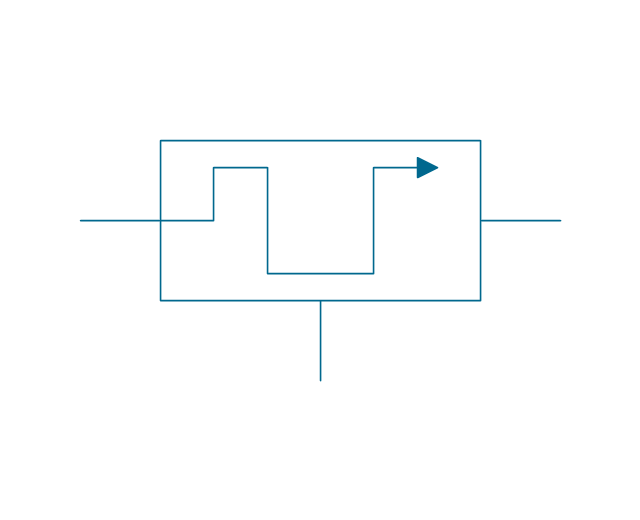
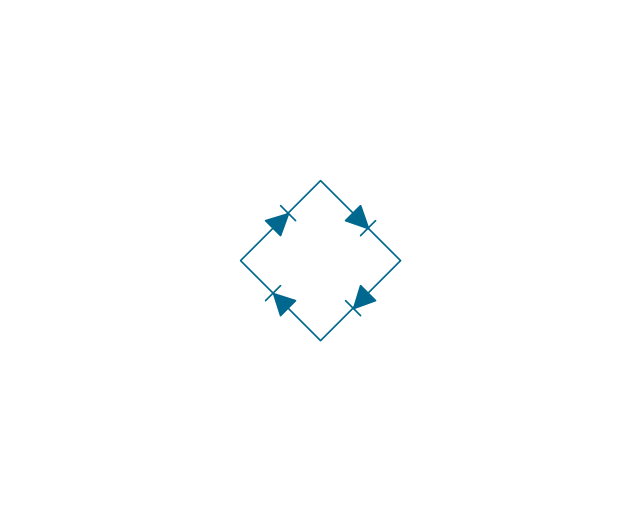
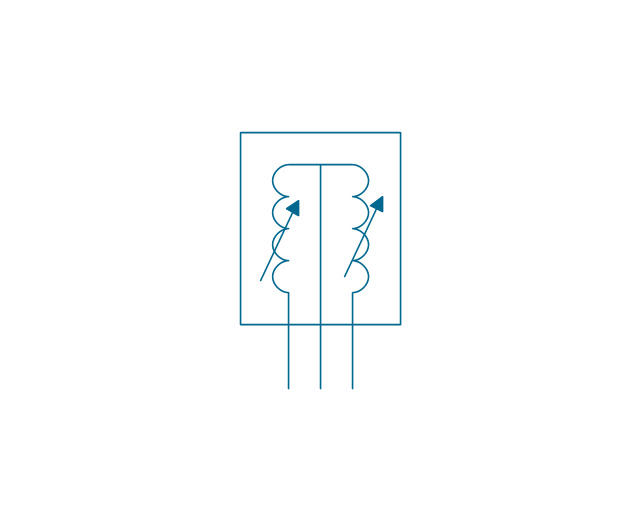
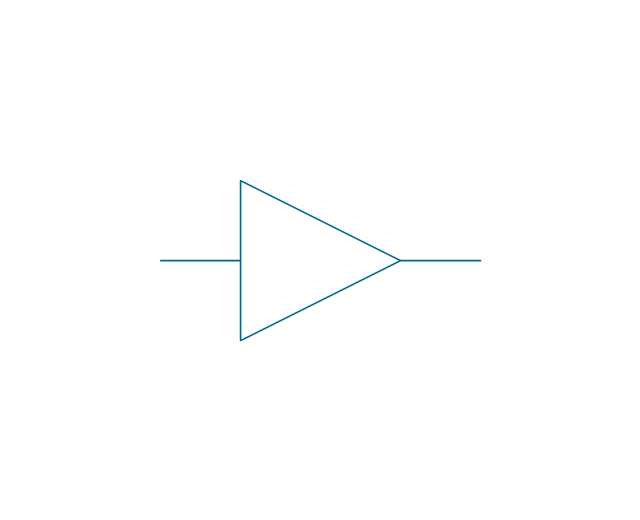
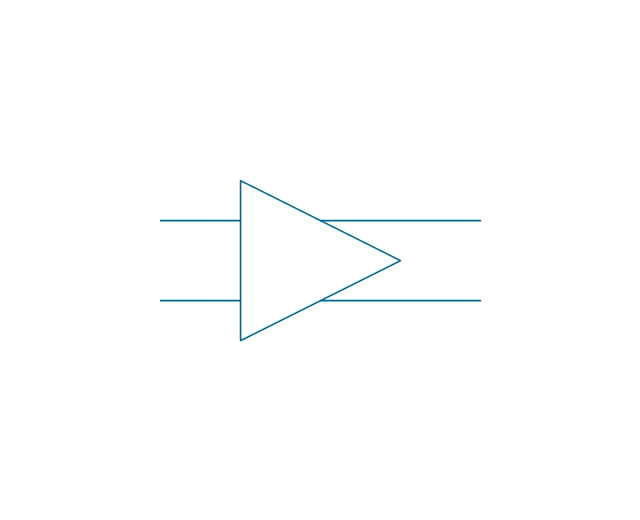
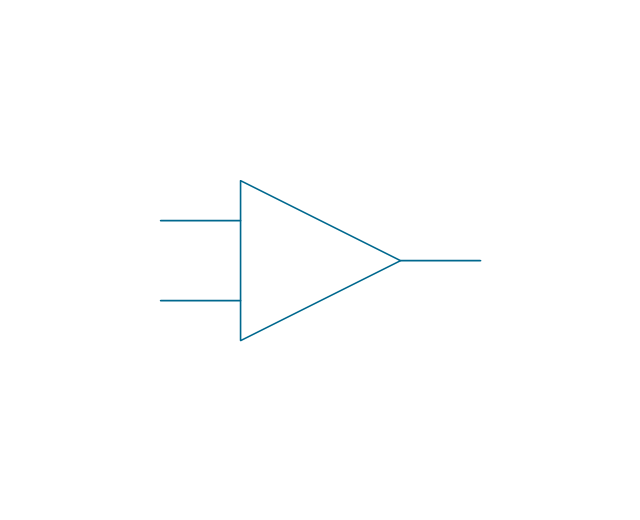
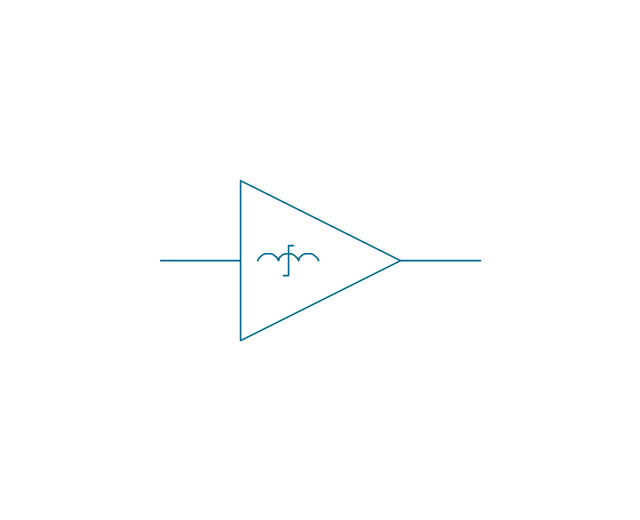
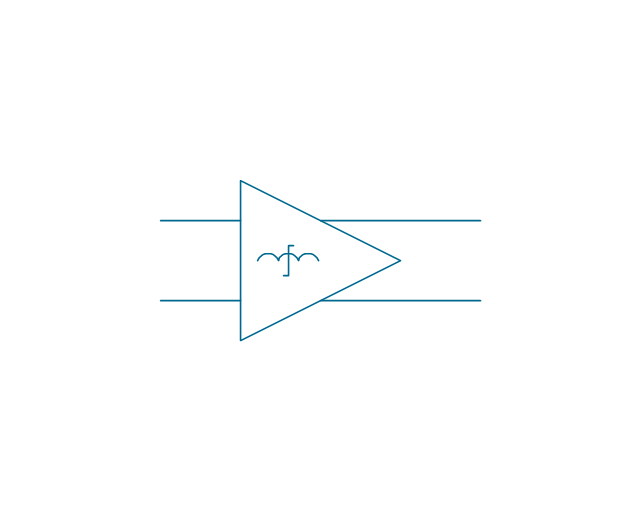
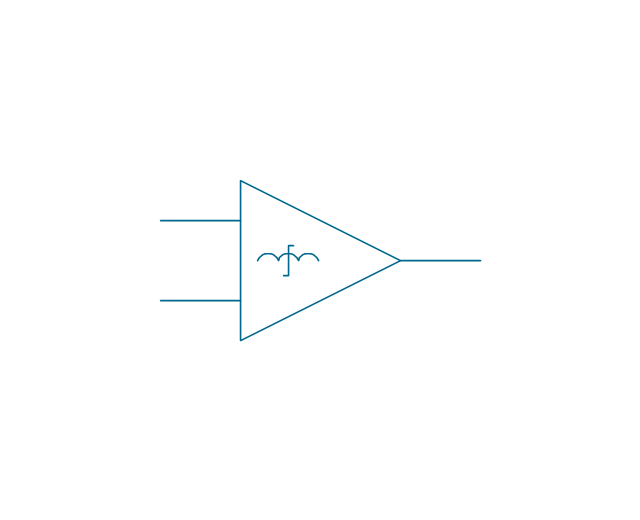
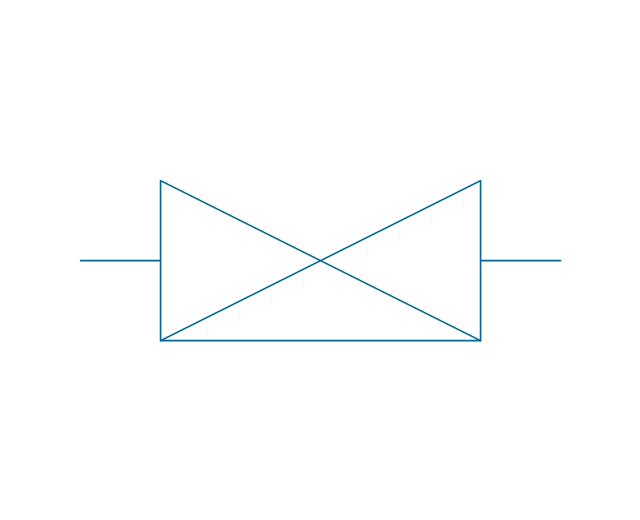
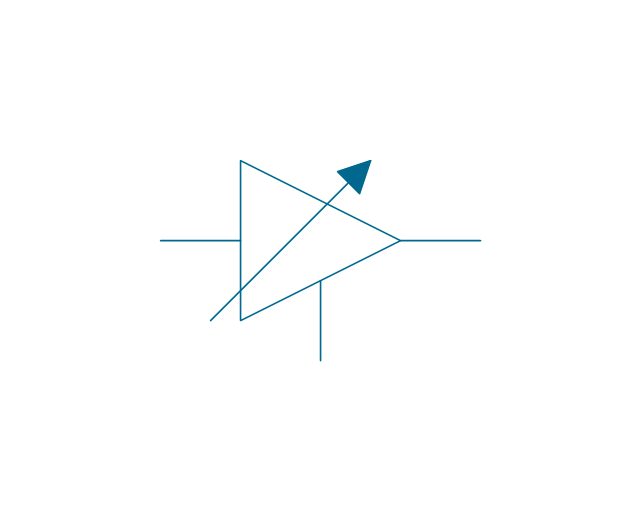
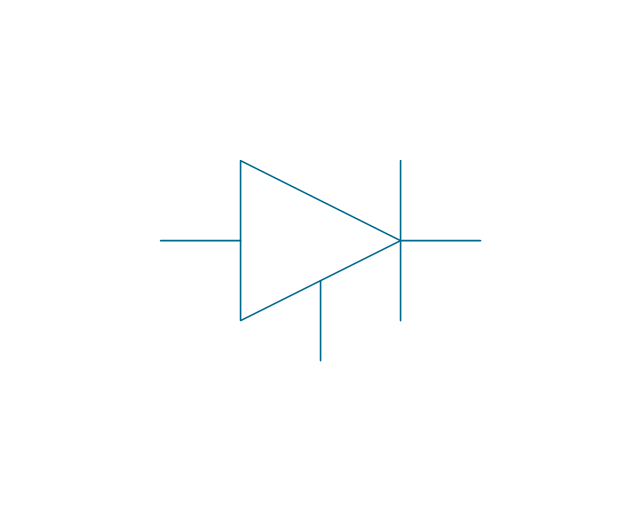
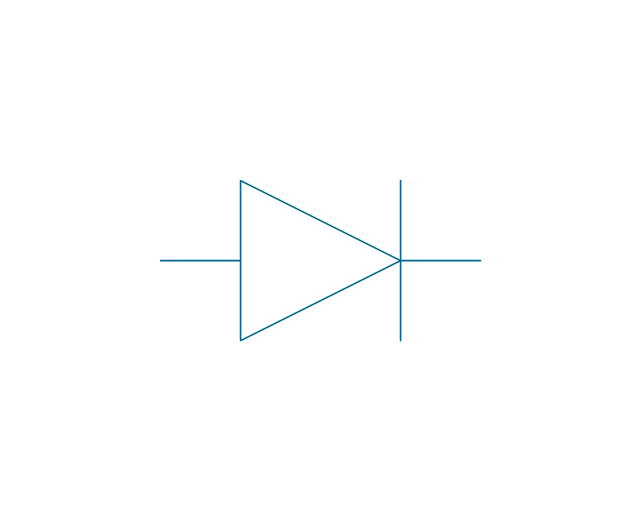
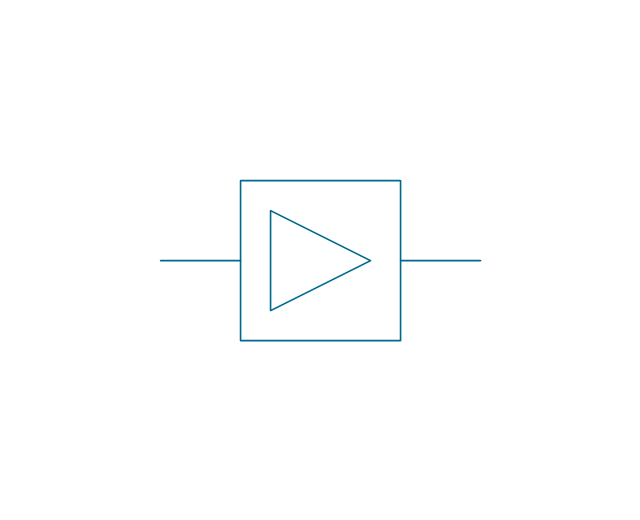
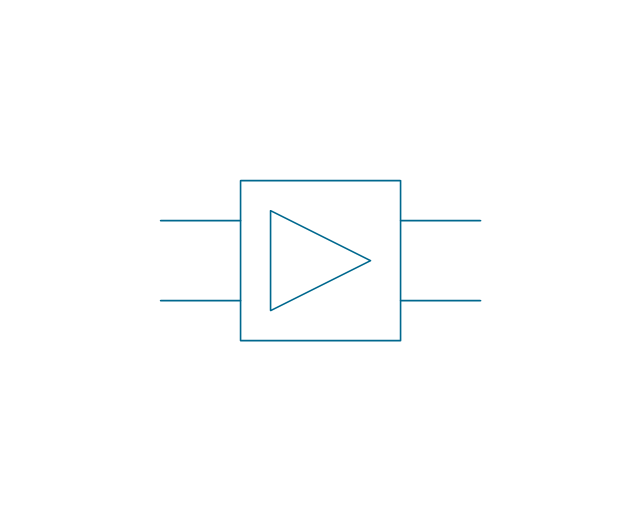
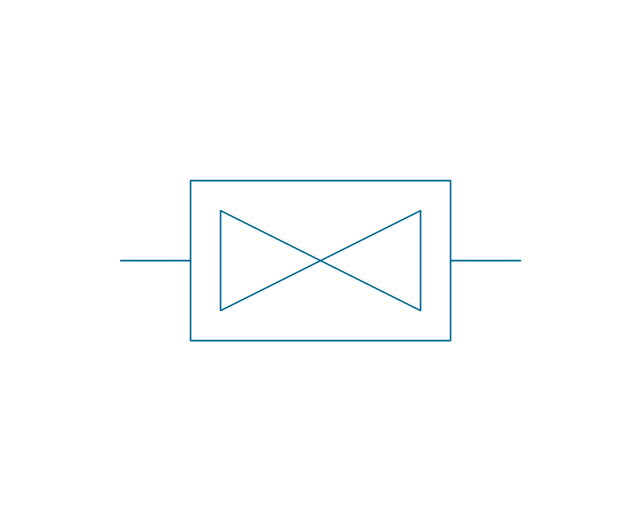
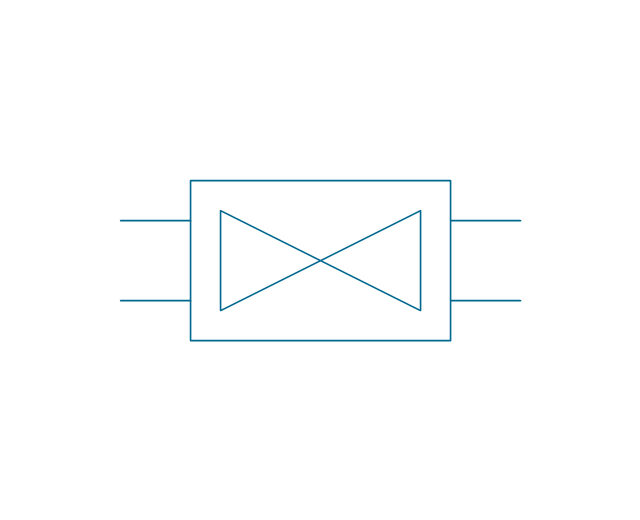
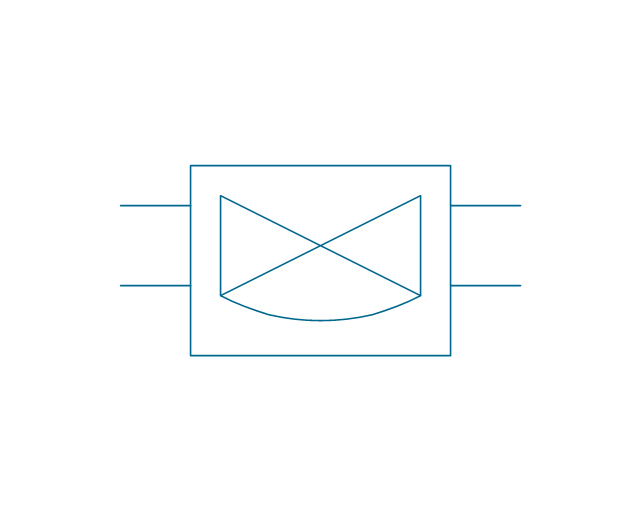
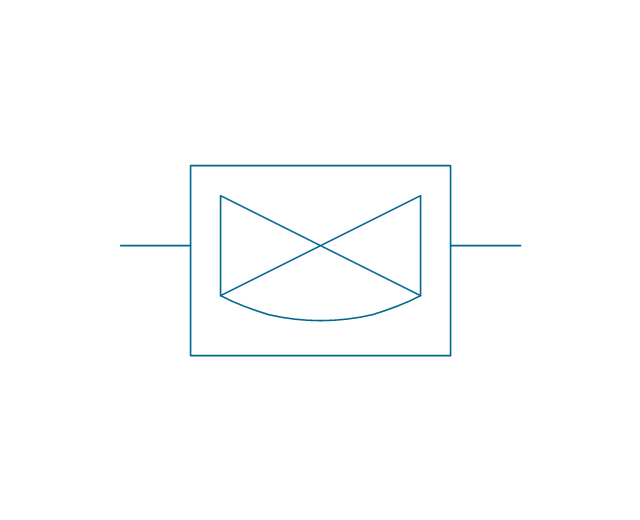
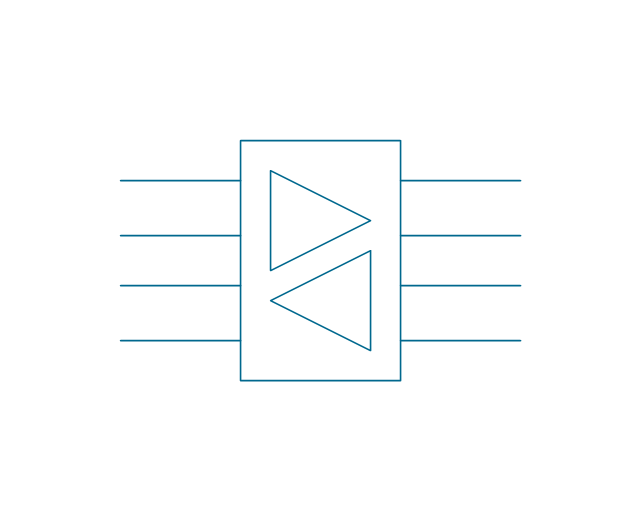
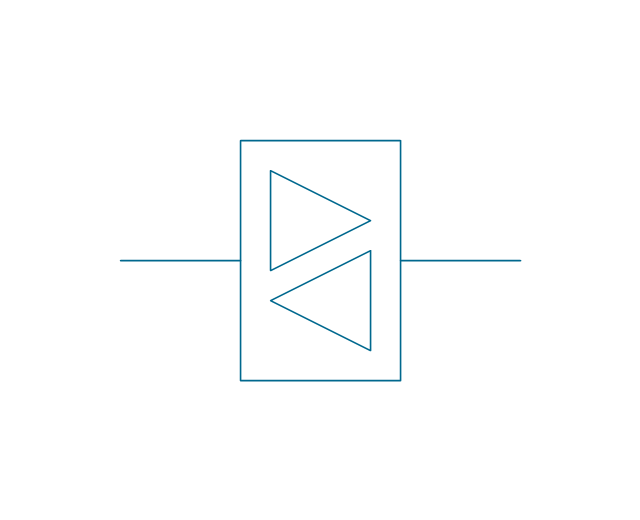
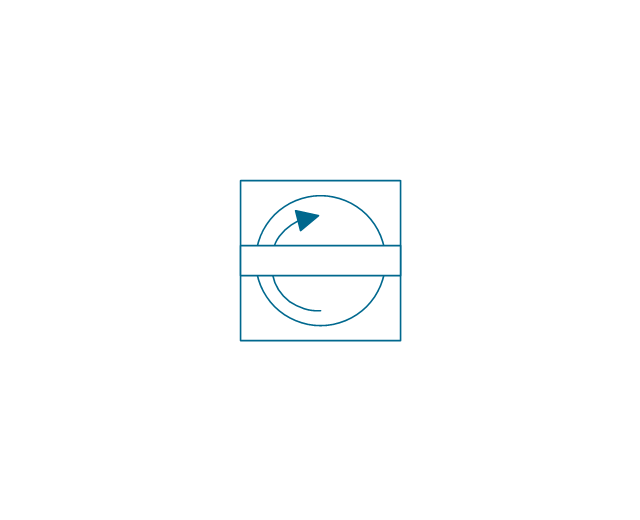
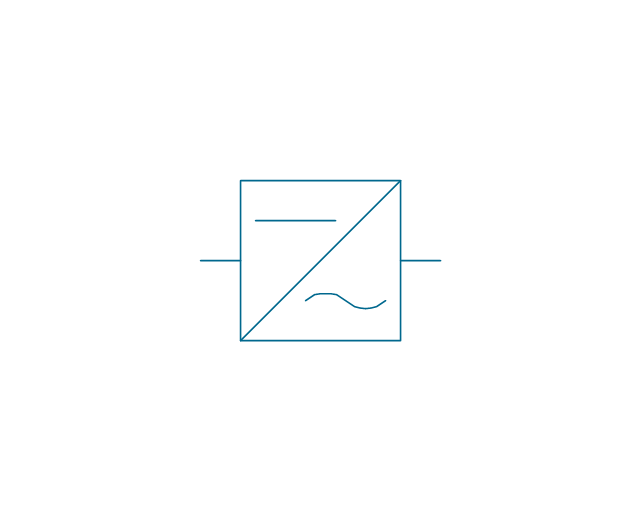
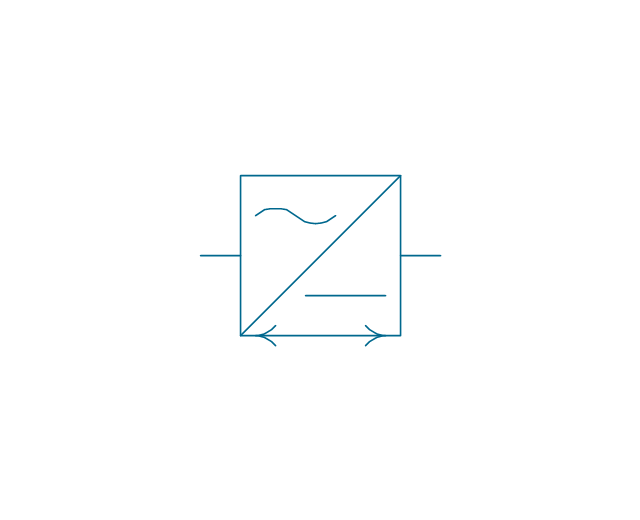
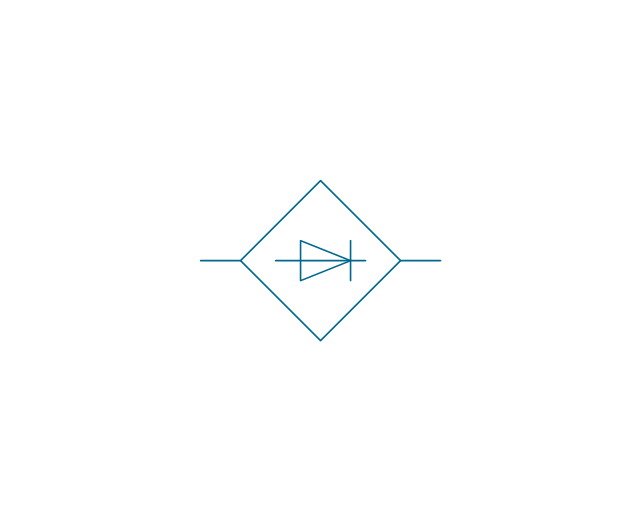
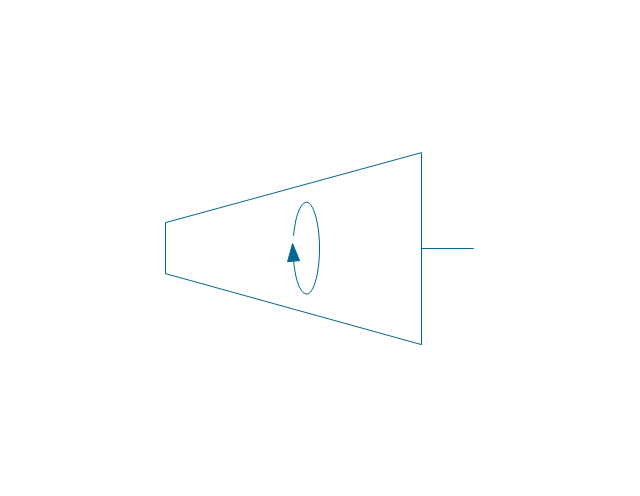
The vector stencils library "Composite assemblies" contains 44 element symbols of transmitters (electronic amplifiers, repeaters), static devices (rectifiers), phase shift circuits, gyroscopes, and gyrators.
Use it to design the electronic circuit diagrams and electrical schematics in the ConceptDraw PRO diagramming and vector drawing software extended with the Electrical Engineering solution from the Engineering area of ConceptDraw Solution Park.
www.conceptdraw.com/ solution-park/ engineering-electrical
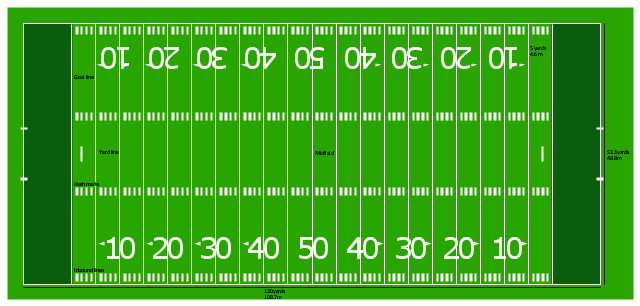
"Football games are played on a rectangular field that measures 120 yards (110 m) long and 53.33 yards (48.76 m) wide. Lines marked along the ends and sides of the field are known respectively as the end lines and side lines, and goal lines are marked 9 yards (8.2 m) outward from each end line. Weighted pylons are placed on the inside corner of the intersections of the goal lines and end lines.
White markings on the field identify the distance from the end zone. Inbound lines, or hash marks, are short parallel lines that mark off 1 yard (0.91 m) increments. Yard lines, which run the width of the field, are marked every 5 yards (4.6 m). A line one yard wide is placed at each end of the field. This line is marked at the center of the two-yard line in professional play and at the three-yard line in college play. Numerals that display the yard lines in multiples of ten are placed along both sides of the field.
Goalposts are at the center of the plane of each of the two end lines. The crossbar of these posts is ten feet (3 meters) above the ground, with vertical uprights at the end of the crossbar 18 feet 6 inches (6 m) apart for professional and collegiate play and 23 feet 4 inches (7 m) apart for high school play. The uprights extend vertically 10 yards on professional fields, a minimum of 10 yards on college fields, and a minimum of ten feet on high school fields. Goal posts are padded at the base, and orange ribbons are normally placed at the tip of each upright." [American football. Wikipedia]
The diagram example "Horizontal colored football field" was created using the ConceptDraw PRO diagramming and vector drawing software extended with the Football solution from the Sport area of ConceptDraw Solution Park.
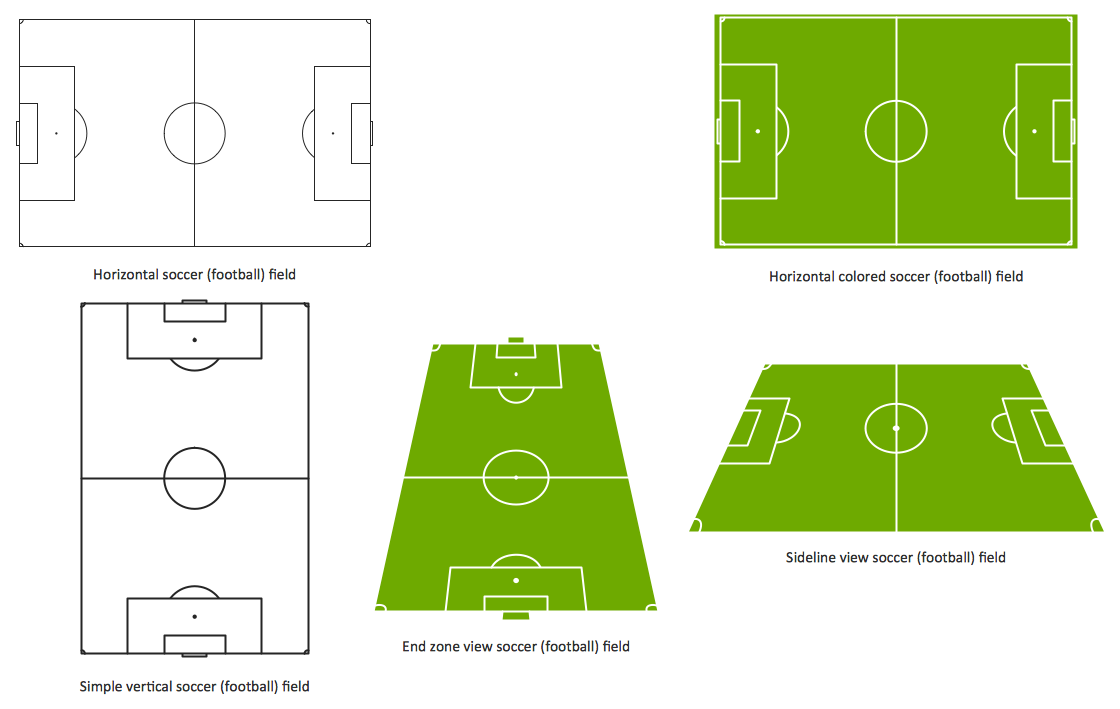
Design a Soccer (Football) Field
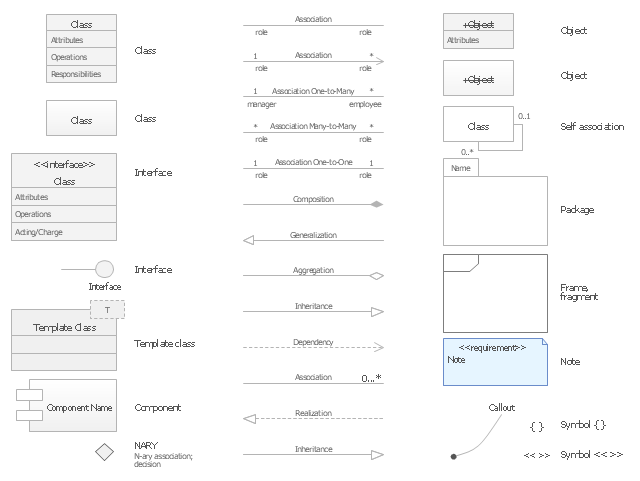
The Soccer (Football) Fields library from the Soccer solution from the Sport area of ConceptDraw Solution Park provides a complete set of predesigned fields: horizontal and vertical located, colored or not, end zone view soccer field.The vector stencils library "UML class diagrams" contains 38 symbols for the ConceptDraw PRO diagramming and vector drawing software.
"... classes are represented with boxes which contain three parts:
(1) The top part contains the name of the class. It is printed in Bold, centered and the first letter capitalized.
(2) The middle part contains the attributes of the class. They are left aligned and the first letter is lower case.
(3) The bottom part gives the methods or operations the class can take or undertake. They are also left aligned and the first letter is lower case. ...
To indicate a classifier scope for a member, its name must be underlined. ...
An association can be named, and the ends of an association can be adorned with role names, ownership indicators, multiplicity, visibility, and other properties. ...
Aggregation ... is graphically represented as a hollow diamond shape on the containing class end of the tree with a single line that connects the contained class to the containing class.
... graphical representation of a composition relationship is a filled diamond shape on the containing class end of the tree of lines that connect contained class(es) to the containing class.
... graphical representation of a Generalization is a hollow triangle shape on the superclass end of the line (or tree of lines) that connects it to one or more subtypes.
... graphical representation of a Realization is a hollow triangle shape on the interface end of the dashed line (or tree of lines) that connects it to one or more implementers. A plain arrow head is used on the interface end of the dashed line that connects it to its users.
Multiplicity ... representation of an association is a line with an optional arrowhead indicating the role of the object(s) in the relationship, and an optional notation at each end indicating the multiplicity of instances of that entity (the number of objects that participate in the association).
Entity classes ... are drawn as circles with a short line attached to the bottom of the circle. Alternatively, they can be drawn as normal classes with the «entity» stereotype notation above the class name." [Class diagram. Wikipedia]
The example "Design elements - UML class diagrams" is included in the Rapid UML solution from the Software Development area of ConceptDraw Solution Park.
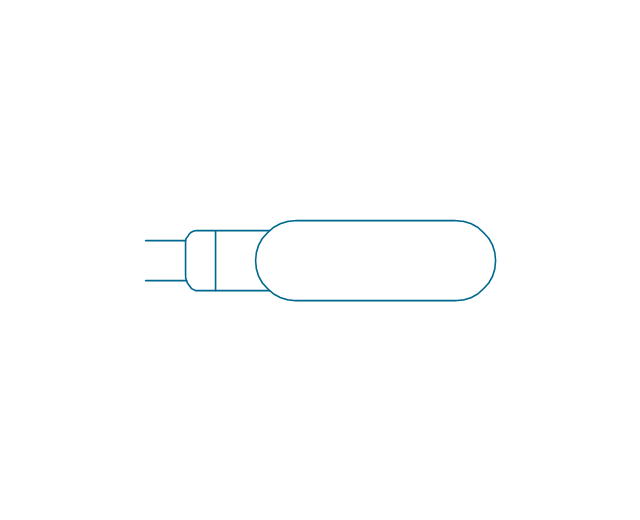
The vector stencils library "Lamps, acoustics, measuring instruments" contains 35 element symbols of lamps, acoustic components, electrical measuring instruments.
Use these shapes for drawing electrical schematics and electronic circuit diagrams in the ConceptDraw PRO diagramming and vector drawing software extended with the Electrical Engineering solution from the Engineering area of ConceptDraw Solution Park.
www.conceptdraw.com/ solution-park/ engineering-electrical
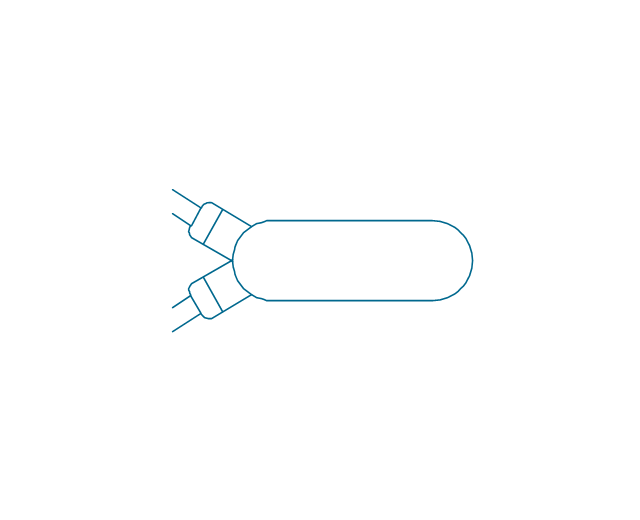
Use these shapes for drawing electrical schematics and electronic circuit diagrams in the ConceptDraw PRO diagramming and vector drawing software extended with the Electrical Engineering solution from the Engineering area of ConceptDraw Solution Park.
www.conceptdraw.com/ solution-park/ engineering-electrical
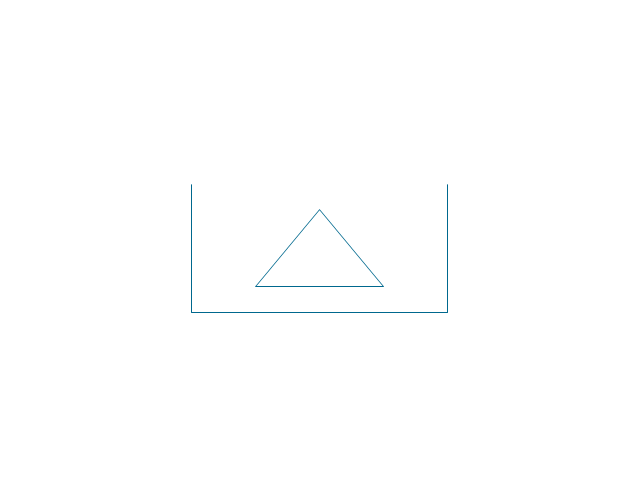
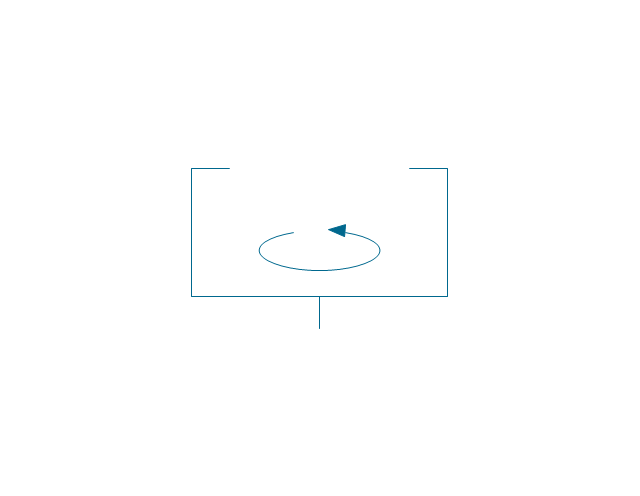
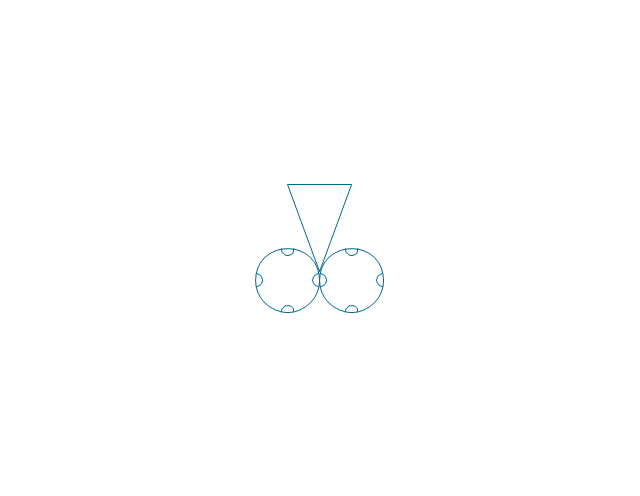
The vector stencils library "Industrial equipment" contains 81 symbols of pumps, compressors, fans, turbines, and power generators.
Use these shapes to design pumping systems, air and fluid compression systems, and industrial process diagrams in the ConceptDraw PRO software extended with the Chemical and Process Engineering solution from the Chemical and Process Engineering area of ConceptDraw Solution Park.
www.conceptdraw.com/ solution-park/ engineering-chemical-process
Ice Hockey Rink Diagram
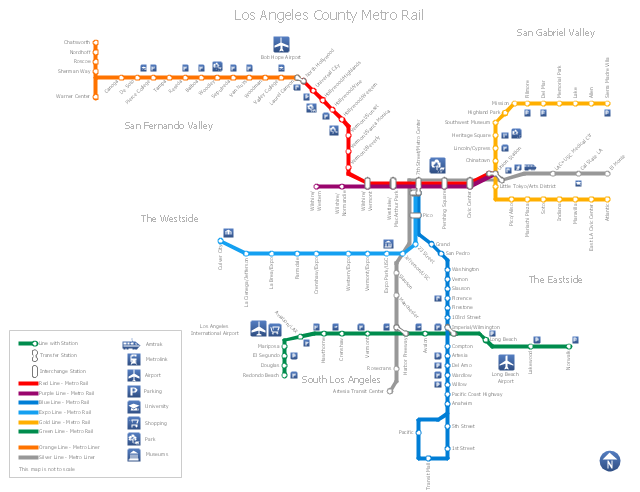
The main advantage of using ConceptDraw Ice Hockey Solution is that you don't need to draw objects manually, you have all you need in libraries, templates and samples. This allows you produce professional ice hockey diagrams as quickly as possible, and then post them to blog or social media, print or present on a large screen."Metro Rail is an urban rail system serving Los Angeles County, California. It consists of six lines, including two rapid transit subway lines (the Red and Purple Lines) and four light rail lines (the Blue, Green, Gold and Expo lines) serving 80 stations. It connects with the Metro Liner bus rapid transit system (the Orange Line and Silver Line) and also with the Metrolink commuter rail systems. The system, which has an average daily weekday ridership of 362,904 as of June 2012, is owned and operated by the Los Angeles County Metropolitan Transportation Authority (Metro) and started service in 1990. It has been extended significantly since that time and several further extensions are either in the works or being considered.
It is the indirect descendant of the Pacific Electric Red Car and Los Angeles Railway Yellow Car lines, which operated between the late 19th century and the 1960s." [Metro Rail (Los Angeles County). Wikipedia]
The transit map example "Los Angeles county Metro Rail map" was created using the ConceptDraw PRO diagramming and vector drawing software extended with the Metro Map solution from the Maps area of ConceptDraw Solution Park.
- Distance From Blue Line To Goal Line
- ERD Symbols and Meanings | Entity Relationship Diagram Symbols ...
- Meaning Of Dotted Line In Er Diagram
- Dotted Line In Flowchart Meaning
- Can Lines Cross Flow Chart
- Lines Block Arrow And Flowcharts Are Located On What Toolbar
- Leased Line Network Diagram
- Design elements - ER diagram (Chen notation) | Football | IDEF9 ...
- Dotted Line Connectors
- Flow Lines
- Er Diagram Single And Double Lines
- Line Chart Templates | Design elements - Time series charts | Line ...
- How to Create a Line Chart | Line Chart Examples | Design ...
- How to Draw a Line Graph | France exports of goods and services ...
- Draw A Plan Of A Rural Water Supply Lines
- Design elements - Line graphs | Design elements - Time series ...
- What Is Flow Lines Terminals Input Output Processing __decision
- Dimension Lines
- Water Lines
