HelpDesk
How to Create a Time Series Dashboard
Time Series Dashboard means integration of some type of diagrams: Line Charts, Bar Charts, Column Charts, and Dot Plots on a single space. The ConceptDraw Time Series Dashboard solution can be used to create the interactive Time Series dashboard. The libraries of Time Series Charts solution contain the Live Objects, that can change their appearance depending on the external data. Each chart from the Time Series dashboard displays particular source data. You can include Time Series Charts in your business or technical dashboards to show and compare the items changing over time.Internet solutions with ConceptDraw DIAGRAM
ConceptDraw is a good means of visualization of information of any kind as it features powerful graphic capabilities. The conception of using ConceptDraw and open formats by the programs that work with Internet can be used for displaying any data and any structure in Internet.HelpDesk
How to Quickly Make a Project from a Mind Map
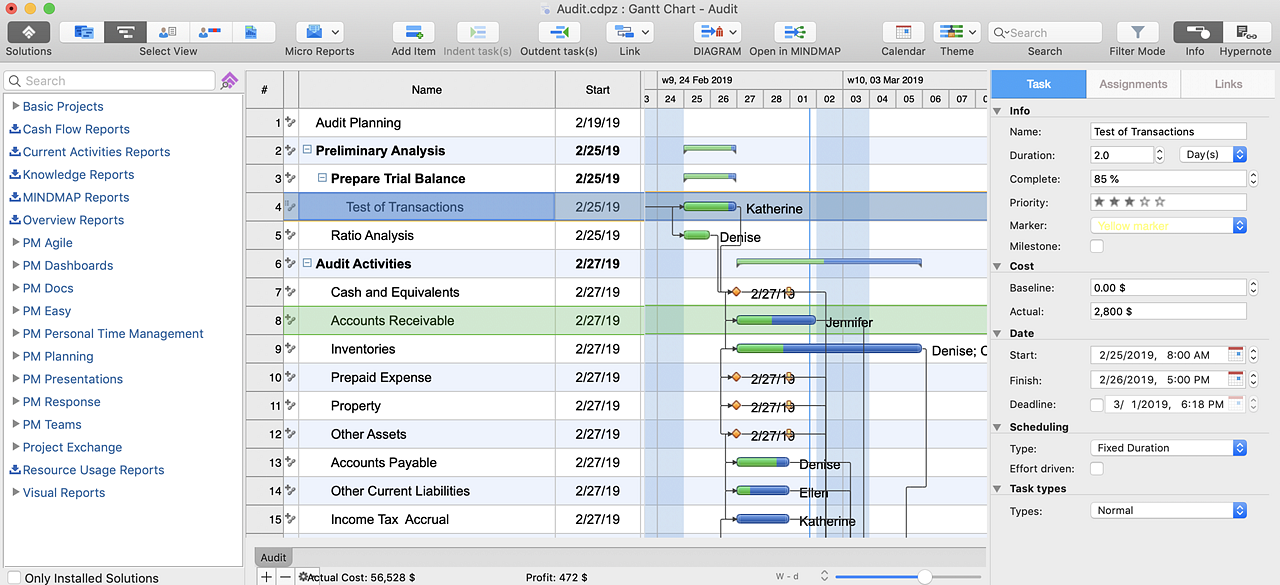
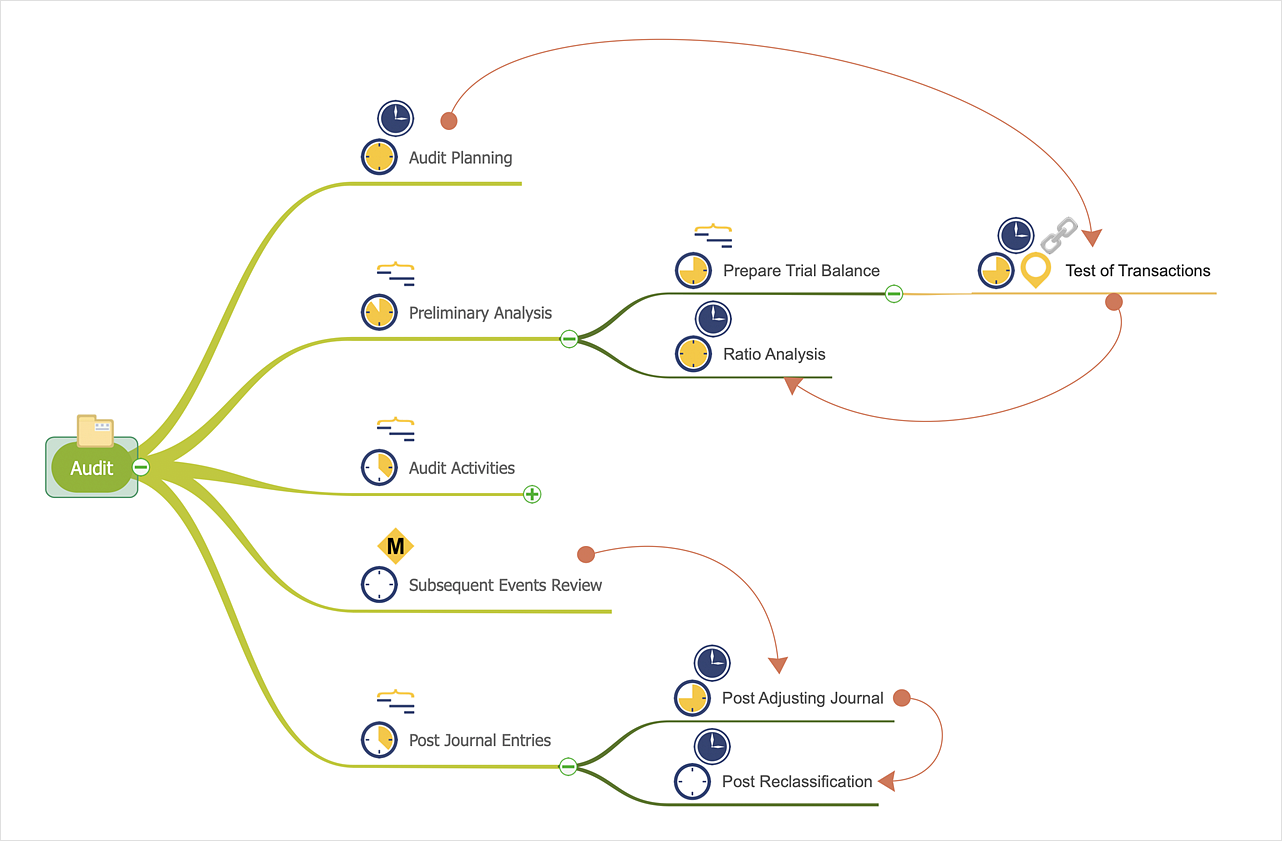
ConceptDraw MINDMAP allows you to view your mind map as a Gantt chart. You can do this by opening your map in ConceptDraw PROJECT. It is possible to proceed with the same file in both ConceptDraw MINDMAP and ConceptDraw PROJECT.HelpDesk
How to Edit a Project Task List
A list of project tasks is core to any project plan. It is the basic part of a project schedule. The project task list should include all of the work associated with fulfilling the project on time. Having an entire and complete task list, the project manager will be able to estimate the costs and resources, necessary to implement the project. The project task list creation is a key piece of project management. The list of project tasks have include activities, should be performed, and the sequence in which tasks need to be completed.HelpDesk
How to Make a Mind Map from a Project Gantt Chart
ConceptDraw Office allows you to see the project data from ConceptDraw PROJECT in a mind map structure by opening your project in ConceptDraw MINDMAP.Bubble diagrams in Landscape Design with ConceptDraw DIAGRAM
Bubble Diagrams are the charts with a bubble presentation of data with obligatory consideration of bubble's sizes. They are analogs of Mind Maps and find their application at many fields, and even in landscape design. At this case the bubbles are applied to illustrate the arrangement of different areas of future landscape design, such as lawns, flowerbeds, playgrounds, pools, recreation areas, etc. Bubble Diagram helps to see instantly the whole project, it is easy for design and quite informative, in most cases it reflects all needed information. Often Bubble Diagram is used as a draft for the future landscape project, on the first stage of its design, and in case of approval of chosen design concept is created advanced detailed landscape plan with specification of plants and used materials. Creation of Bubble Diagrams for landscape in ConceptDraw DIAGRAM software is an easy task thanks to the Bubble Diagrams solution from "Diagrams" area. You can use the ready scanned location plan as the base or create it easy using the special ConceptDraw libraries and templates.- Communication Links Examples
- Design elements - ERD (crow's foot notation) | Entity Relationship ...
- Design elements - ERD (crow's foot notation) | UML Notation ...
- Metropolitan area networks (MAN). Computer and Network Examples
- Tree Network Topology Diagram | Fully Connected Network ...
- Data Flow Diagrams | Entity Relationship Diagram Symbols and ...
- Data Communication Network With Diagram
- How To Link Task Using Conceptdraw
- Wide area network (WAN) topology. Computer and Network Examples
- Physical LAN and WAN diagram
- Metropolitan area networks (MAN). Computer and Network ...
- Local area network (LAN). Computer and Network Examples ...
- Local area network (LAN). Computer and Network Examples ...
- Storage area networks (SAN). Computer and Network Examples ...
- Vector stencils library - IDEF3 process schematic symbols | Vector ...
- BPMN 2.0 | Trouble ticket system - BPMN 2.0 diagram | Design ...
- Call center network diagram | Trouble ticket system - BPMN 2.0 ...
- How to Convert a Visio Stencils for Use in ConceptDraw PRO ...
- Roaming wireless local area network diagram | Call center network ...
- Home area networks (HAN). Computer and Network Examples ...


