HelpDesk
How to Connect Text Data to a Time Series Chart on Your Live Dashboard
Time Series Dashboard means an integration of some type of diagrams: Line Charts, Bar Charts, Column Charts, and Dot Plots on a single space. The ConceptDraw Time Series Dashboard solution can be used to create the interactive Time Series dashboard. The libraries of Time Series Charts solution contain the Live Objects, that can change their appearance depending on the external data. Each chart from the Time Series dashboard displays particular source data. You can include Time Series Charts in your business or technical dashboards to show and compare the items changing over time.
HelpDesk
How to Create an ERD Diagram
ERD (entity relationship diagram) is used to show the logical structure of databases. It represents the interrelationships between components of database (entities). Entity relationship diagrams are a widely used in software engineering. Using ERD software engineers can control the every aspect of database development. ER diagram can be used as guide for testing and communicating before the release of software product. ERD displays data as entities that are connected with connections that show the relationships between entities. There is some ERD notations used by data bases developers for representing the relationships between the data objects. ConceptDraw PRO and its ERD solution allow you to build ERD diagram of any notation.HelpDesk
How to Edit a Project Task List
A list of a project tasks is core to any project plan. It is the basic part of a project schedule. The project task list should include all of the work associated with fulfilling the project on time. Having an entire and complete task list, the project manager will be able to estimate the costs and resources, necessary to implement the project. The project task list creation is a key piece of project management. The list of project tasks have include activities, should be performed, and the sequence in which tasks need to be completed."A call centre or call center is a centralised office used for the purpose of receiving or transmitting a large volume of requests by telephone. An inbound call centre is operated by a company to administer incoming product support or information inquiries from consumers. Outbound call centers are operated for telemarketing, solicitation of charitable or political donations, debt collection and market research. In addition to a call centre, collective handling of letter, fax, live support software,social media and e-mail at one location is known as a contact centre.
A call centre is operated through an extensive open workspace for call centre agents, with work stations that include a computer for each agent, a telephone set or headset connected to a telecom switch, and one or more supervisor stations. It can be independently operated or networked with additional centres, often linked to a corporate computer network, including mainframes, microcomputers and LANs. Increasingly, the voice and data pathways into the centre are linked through a set of new technologies called computer telephony integration (CTI)." [Call centre. Wikipedia]
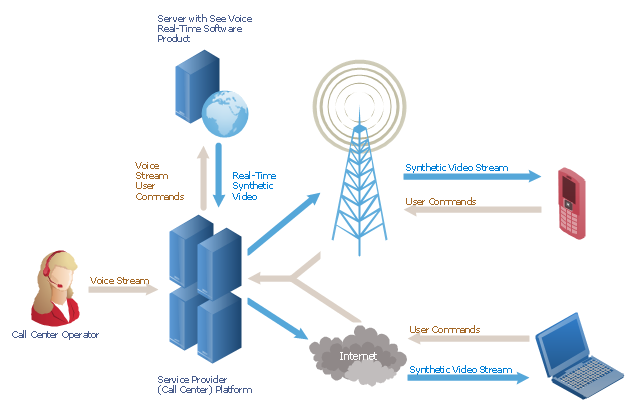
This call center network diagram example was created using the ConceptDraw PRO diagramming and vector drawing software extended with the Telecommunication Network Diagrams solution from the Computer and Networks area of ConceptDraw Solution Park.
- Design elements - ERD (crow's foot notation) | Entity Relationship ...
- Roaming wireless local area network diagram | Call center network ...
- Local area network (LAN). Computer and Network Examples ...
- Call center network diagram | Basic Flowchart Symbols and ...
- Home area networks (HAN). Computer and Network Examples ...
- Example Data Center Network Diagram
- Physical LAN and WAN diagram
- Call center network diagram | Trouble ticket system - BPMN 2.0 ...
- Wide area network (WAN) topology. Computer and Network Examples
- Call center network diagram | Telecommunication Network ...
- Amazon Web Services Diagrams diagramming tool for architecture ...
- AWS Architecture Diagrams | Diagramming tool - Amazon Web ...
- Microsoft Azure | How to Create an Azure Architecture Diagram ...
- Build Network Diagram Online
- Call center network diagram | Telecommunication Network ...
- AWS 2.3 Architecture Diagrams | Network Diagramming Software for ...
- Data Flow Diagrams | Entity Relationship Diagram Symbols and ...
- Roaming wireless local area network diagram | Fully Connected ...
- Design elements - Azure architecture - Symbols | Azure Architecture ...
- Local area network (LAN). Computer and Network Examples ...


