This site uses cookies. By continuing to browse the ConceptDraw site you are agreeing to our Use of Site Cookies.
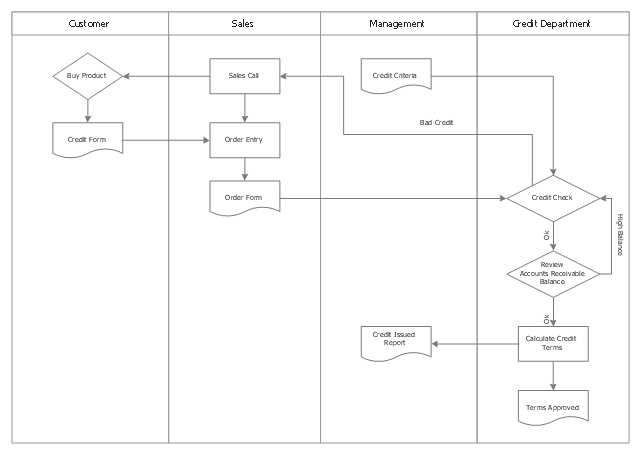
This cross-functional flowchart sample shows the credit approval process.
"Credit (from Latin credo translation. "I believe" ) is the trust which allows one party to provide resources to another party where that second party does not reimburse the first party immediately (thereby generating a debt), but instead arranges either to repay or return those resources (or other materials of equal value) at a later date. The resources provided may be financial (e.g. granting a loan), or they may consist of goods or services (e.g. consumer credit). Credit encompasses any form of deferred payment. Credit is extended by a creditor, also known as a lender, to a debtor, also known as a borrower." [Credit (finance). Wikipedia]
The swim lane diagram example "Process flow - Credit approval" was created using the ConceptDraw PRO diagramming and vector drawing software extended with the Process Flowcharts solution from the Business Processes area of ConceptDraw Solution Park.
Swim lane diagram
Swim lane diagram, swim lanes, vertical swimlanes, process, document, decision,

cross-functional flowchart template, flowchart, example business process flow Cross-Functional Flowcharts

cross-functional flowchart template, flowchart, example business process flow
The Cross-Functional Flowcharts solution extends ConceptDraw DIAGRAM software with cross functional flowchart examples, samples, and libraries of cross functional flow chart vector design elements and CH-1 symbols for easy drawing professional-looking and illustrative Cross Functional Flowchart, Cross Functional Diagram, CH-1 Diagram, Process Flowchart, Deployment Flowchart, Opportunity Flowchart, Swimlane Process Mapping Diagram, or Visio Cross Functional Flowchart for planning and further analyzing, optimizing and improvement processes. The use of included pre-made cross functional flowchart template, opportunity flowchart template, and swimlane process map template, greatly easier designing your Cross-functional flowcharts.

Understanding the Audit Process: A Comprehensive Guide. Audit Process Flowchart

Audit Process Flowchart, Audit Flowchart - Audit Flowcharts solution for ConceptDraw DIAGRAM Solution Park provides the Audit Flowcharts library with wide variety of predesigned audit flowchart symbols, and also the set of templates and samples allowing you design your own audit flowchart or audit process flowchart in one moment. Simply use any of offered samples and change it for your needs, or fill the desired template.

customer journey, journey map, customer journey mapping tools, journey mapping, customer experience map, consumer journey, user journey, customer mapping, experience map, customer journey mapping process Customer Journey Mapping

customer journey, journey map, customer journey mapping tools, journey mapping, customer experience map, consumer journey, user journey, customer mapping, experience map, customer journey mapping process
Customer Journey Mapping Solution for ConceptDraw DIAGRAM opens incredibly broad opportunities for marketing and business specialists, product managers, designers, engineers, and other people interested in business development, increasing the product’s audience, its success and users' demand, providing them with capabilities of customer journey mapping. The included diagramming and customer journey mapping tools, predesigned vector customer journey mapping icons and charts, consumer journey mapping connectors, user journey and customer mapping figures, customer experience map icons and touchpoint icons, quick-start templates and samples provide excellent conditions for the customer journey mapping process, for creating Customer Journey Map and Customer Experience Map.

entity-relationship diagram, ER-diagram, database ERD Entity-Relationship Diagram (ERD)

entity-relationship diagram, ER-diagram, database ERD
Entity-Relationship Diagram (ERD) solution extends ConceptDraw DIAGRAM charting and vector drawing software with the ability to describe a database using the Entity-Relationship model. This solution includes icons advocated by Chen’s and Crow’s Foot notation that can be used when describing a database. The vector graphic diagrams produced when using this solution can be employed in your white papers, presentations, data sheets, posters, or any technical material.

landscape plan, how to design a garden, modern garden design, how to design landscape, landscape design tools Landscape & Garden

landscape plan, how to design a garden, modern garden design, how to design landscape, landscape design tools
The Landscape and Gardens solution for ConceptDraw DIAGRAM is the ideal drawing tool when creating landscape plans. Any gardener wondering how to design a garden can find the most effective way with Landscape and Gardens solution.
"Order processing is a key element of Order fulfillment. Order processing operations or facilities are commonly called "distribution centers". "Order processing" is the term generally used to describe the process or the work flow associated with the picking, packing and delivery of the packed item(s) to a shipping carrier. The specific "order fulfillment process" or the operational procedures of distribution centers are determined by many factors. Each distribution center has its own unique requirements or priorities." [Order processing. Wikipedia]
The vertical cross-functional flow chart example "Order processing" was created using the ConceptDraw PRO diagramming and vector drawing software extended with the Flowcharts solution from the area "What is a Diagram" of ConceptDraw Solution Park.
Cross-functional flowchart
Cross-functional flowchart, terminator, swimlanes, cross-functional, process, decision,
Used Solutions
"Trade credit.
The word credit is used in commercial trade in the term "trade credit" to refer to the approval for delayed payments for purchased goods. Credit is sometimes not granted to a person who has financial instability or difficulty. Companies frequently offer credit to their customers as part of the terms of a purchase agreement. Organizations that offer credit to their customers frequently employ a credit manager." [Credit (finance). Wikipedia]
The vertical cross-functional flowchart example "Credit approval process" was created using the ConceptDraw PRO diagramming and vector drawing software extended with the Flowcharts solution from the area "What is a Diagram" of ConceptDraw Solution Park.
Vertical cross-functional flowchart
Vertical cross-functional flowchart, swimlanes, cross-functional, process, document, decision,
Used Solutions

process flow diagram, process flow chart Process Flowcharts

process flow diagram, process flow chart
This solution extends ConceptDraw DIAGRAM software with templates, samples, and library of vector shapes for drawing the Process Flowcharts.

Scrum

What is Scrum? Scrum is the famous agile software development methodology which depicts an iterative and incremental approach for the work on the complex projects. Use ConceptDraw DIAGRAM diagramming and vector drawing software extended with SCRUM Workflow solution to draw various types of professional-looking Scrum Charts, Scrum Workflow Diagrams, Scrum Mind Maps, Scrum boards and attractive Scrum Infographics.

Basic Flowchart Images. Flowchart Examples

This sample was created in ConceptDraw DIAGRAM diagramming and vector drawing software using the Flowcharts solution from the Diagrams area of ConceptDraw Solution Park. This sample shows the Flowchart that displays the procedures of 2PP (two-party preferred) voting and counting the voters. The two-party-preferred vote is the result of the elections that was distributed to the final two parties.

economic system, infographic, infographic examples, market economy, best infographics, economic activities Economy Infographics

economic system, infographic, infographic examples, market economy, best infographics, economic activities
The Economy Infographics solution provides a large collection of vector icon libraries, drawing samples and infographic examples for quick and simple design of the best infographics, illustrations, and presentations about economics, markets, economic policy, business, finances, government and social institutions, production, distribution, and consumption of goods and services, economic diagrams and schemes, economic activities designs, continent and country economic maps, economic presentations, market economy and economic system infographic charts, illustrations in economic articles, reports in mass media, and blog posts in social media. It is a valuable tool for wide range of economists, politicians, managers, marketing experts, business analysts, journalists and bloggers focusing on economy, educators and students studying economics, and many other people to communicate visually the economic information.
This BPMN (Business Process Model and Notation) diagram sample depicts the booking process workflow.
"The vision of BPMN 2.0 is to have one single specification for a new Business Process Model and Notation that defines the notation, metamodel and interchange format but with a modified name that still preserves the "BPMN" brand. The features include:
(1) Aligning BPMN with the business process definition meta model BPDM to form a single consistent language.
(2) Enabling the exchange of business process models and their diagram layouts among process modeling tools to preserve semantic integrity.
(3) Expand BPMN to allow model orchestrations and choreographies as stand-alone or integrated models.
(4) Support the display and interchange of different perspectives on a model that allow a user to focus on specific concerns.
(5) Serialize BPMN and provide XML schemes for model transformation and to extend BPMN towards business modeling and executive decision support." [Business Process Model and Notation. Wikipedia]
The business process modeling diagram example "Booking process - BPMN 2.0 diagram" was designed using the ConceptDraw PRO diagramming and vector drawing software extended with the Business Process Diagram solution from the Business Processes area of ConceptDraw Solution Park.
Business process modeling
Business process modeling, user, timer, task, service, sequence flow, send, receive, none, start, none, end, message, exclusive gateway, event-based gateway,

project management, scrum, agile, business Project Management Package

project management, scrum, agile, business
Project Management Package includes a large set of graphical solutions from the ConceptDraw Solution Park. They are selected specially to help in completing the business and management goals, creating business models and modeling business processes, analyzing business progress and efficiency of projects implementation. The tools of this package's solutions are helpful to create number of diagrams and dashboards including Management Diagrams, Business diagrams, Bubble diagrams, Circle-spoke diagrams, Circular arrows diagrams, Venn diagrams, Scrum charts, Kanban boards, Business Intelligence maps, Business Metric charts, Dynamic charts, Project diagrams, Hierarchical charts, Influence diagrams, Work Breakdown Structures (WBS), Resource Breakdown Structures (RBS), PERT Diagrams, Project management charts, Project timelines, Gantt Charts, Funnel diagrams, Stakeholder Onion diagrams, and many more.

Cross Functional Diagram

You want design the Cross Functional Diagram and need powerful software? Then ConceptDraw DIAGRAM diagramming and vector drawing software extended with Cross-Functional Flowcharts Solution is exactly what you need.

SysML

Systems Modeling Language (SysML) is a general-purpose modeling language for systems engineering applications. ConceptDraw DIAGRAM diagramming and vector drawing software was extended with SysML Solution from the Software Development Area of ConceptDraw Solution Park specially to help systems engineers design various model systems with SysML.

scrum, agile methodology, scrum methodology, scrum board Scrum Workflow

scrum, agile methodology, scrum methodology, scrum board
The Scrum Workflow Solution extends the capabilities of ConceptDraw DIAGRAM with a large collection of professionally-designed samples and a selection of ready-to-use scrum design elements: scrum diagrams and arrows, scrum icons of people, artifacts, workflow, workspace and other colorful scrum clipart, and also scrum charts.

Components of ER Diagram

Entity-Relationship model gives the possibility to visually describe a database using the components of ER Diagram, entity relationship stencils, relationship symbols, work flow shapes. ER-diagram lets represent the data or entities, attributes of these entities and relationships between them, using standardized Crow’s Foot notation icons or Chen’s notation icons. An entity is an object of the real world, it can exist independently and has the instances which differ in attribute values (properties). The attributes give an unambiguous (uniquely) identification for the instance and are called the primary key, this key can be composite and combine several attributes. ConceptDraw DIAGRAM is a professional software available with Entity-Relationship Diagram (ERD) solution from Software Development area that lets create ERDs for various database systems, using Crow’s Foot and Chen’s notations. It is invaluable tool for software engineers and developers, it supports ODBC-compatible databases (Oracle, MySQL, MS Access, MS SQL, InterBase, Firebird and others).

Pyramid Diagram

The DIKW Pyramid refers loosely to a class of models for representing purported structural and/or functional relationships between data, information, knowledge, and wisdom.

business process, business process flow Business Processes Area

business process, business process flow
Solutions of Business Processes area extend ConceptDraw DIAGRAM software with samples, templates and vector stencils libraries for drawing business process diagrams and flowcharts for business process management.