How tо Represent Information Graphically
ConceptDraw Infographics is a great visual tool for communicating the large amounts of data and graphic visualization and representations of data and information.Spatial infographics Design Elements: Location Map
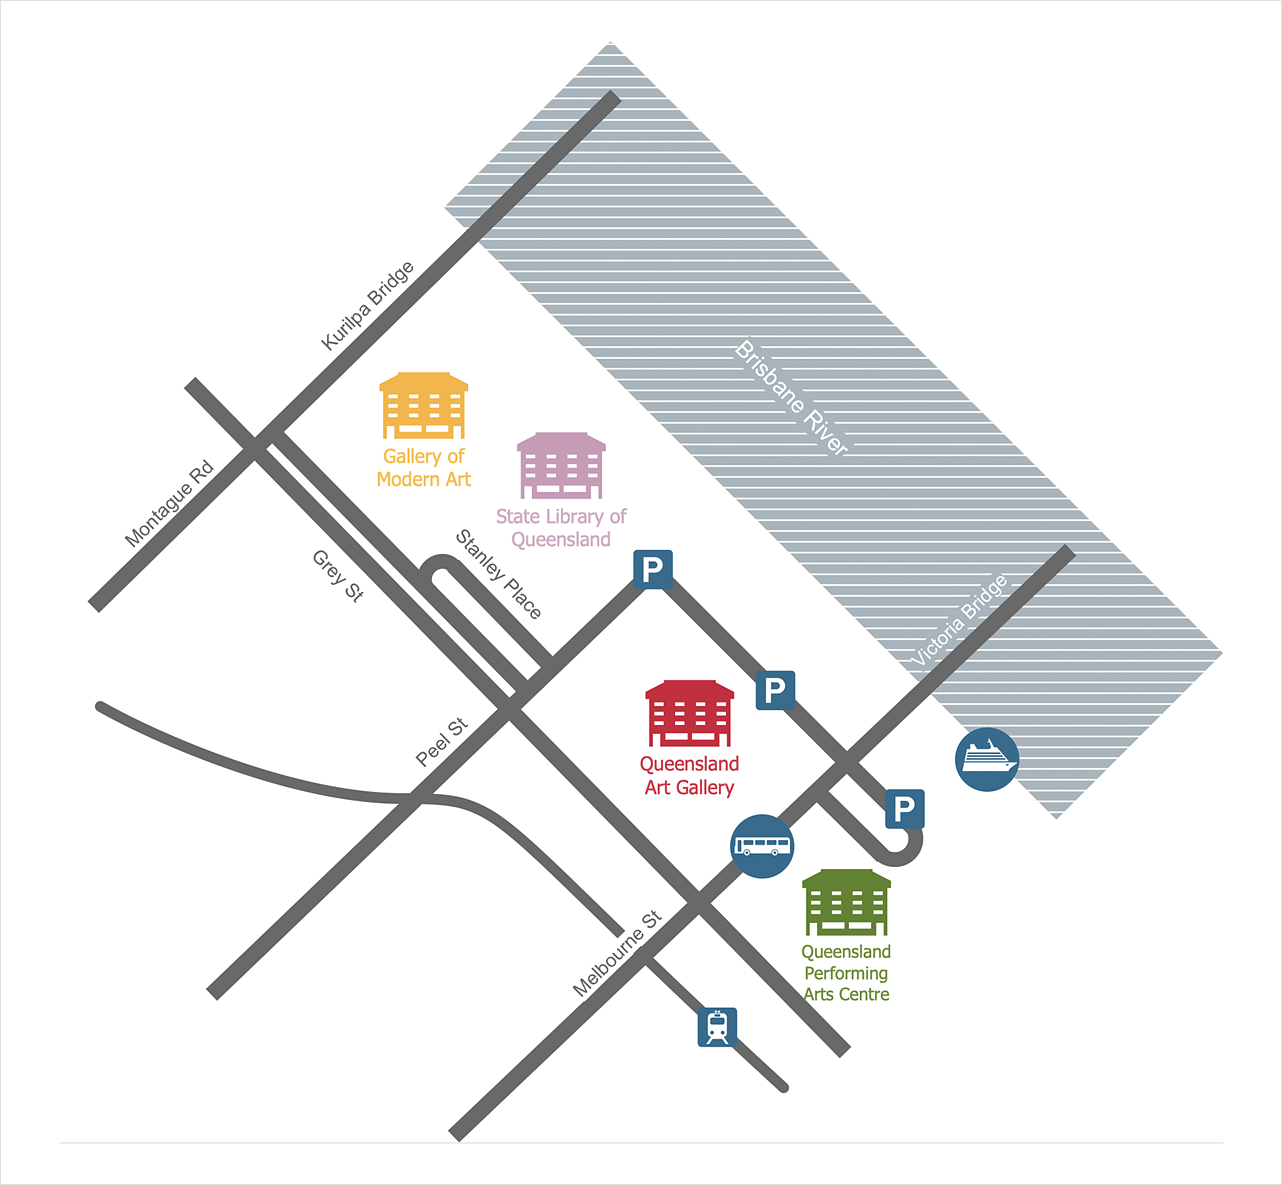
Infographic Design Elements for visually present various geographically distributed information.Spatial infographics Design Elements: Transport Map
Do you like infographics and data visualization? Creating infographics is super-easy with ConceptDraw.Map Infographic Tool
ConceptDraw is a data visualization tool, which can help you to create a map infographics. Anyone can do this, it's that easy!Excellent Examples of Infographic Maps
Create Spatial infographics with ConceptDraw using its excellent examples of infographic maps. We hope these can inspire and teach you!HelpDesk
How to Create a Directional Map
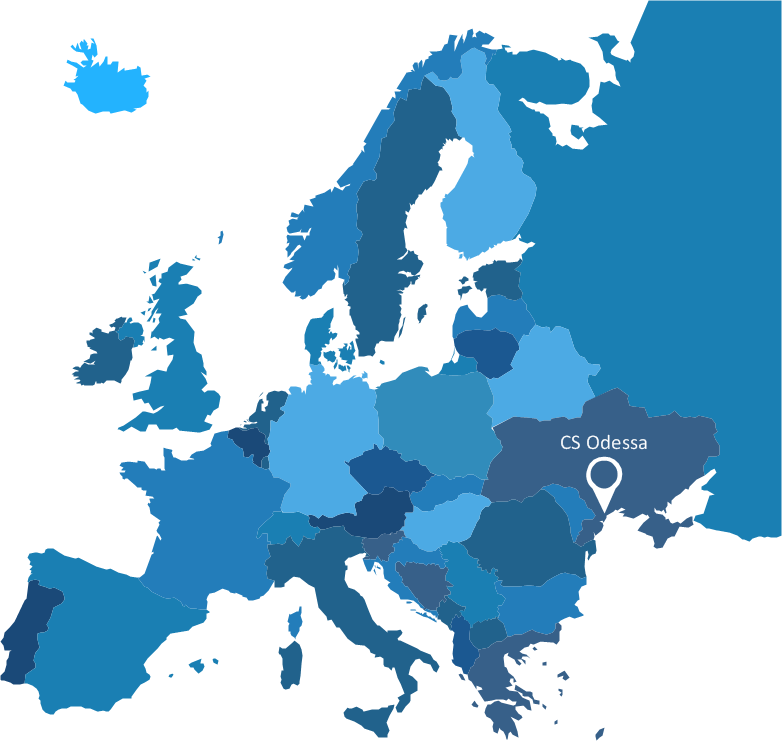
Travelers often use directional maps to find directions for certain places. These maps are guiding millions of tourists to explore towns and cities worldwide. Searching addresses on a map, view nearby businesses, get driving directions - this is only a little of what directional maps is needed. ConceptDraw DIAGRAM allows you to create various kinds of directional maps. You can easily visualize city maps or destinations with driving directions and traveler information using special vector stencils libraries.Spatial infographics Design Elements: Continental Map
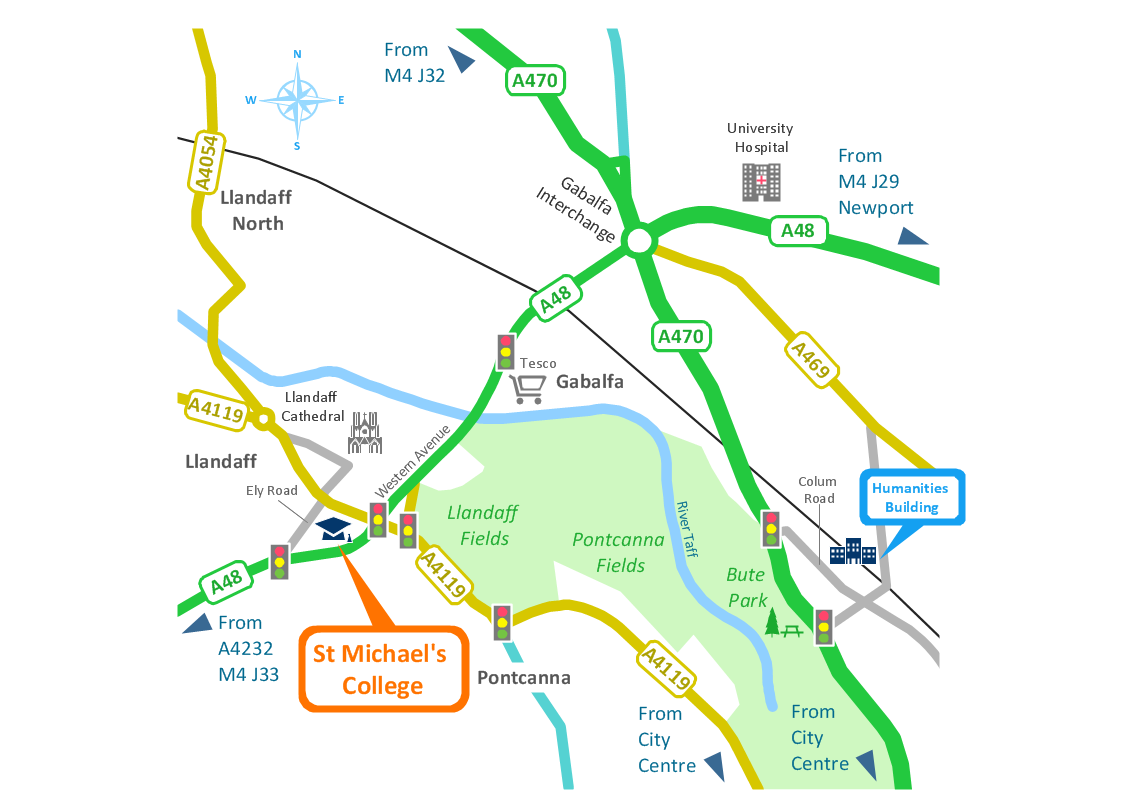
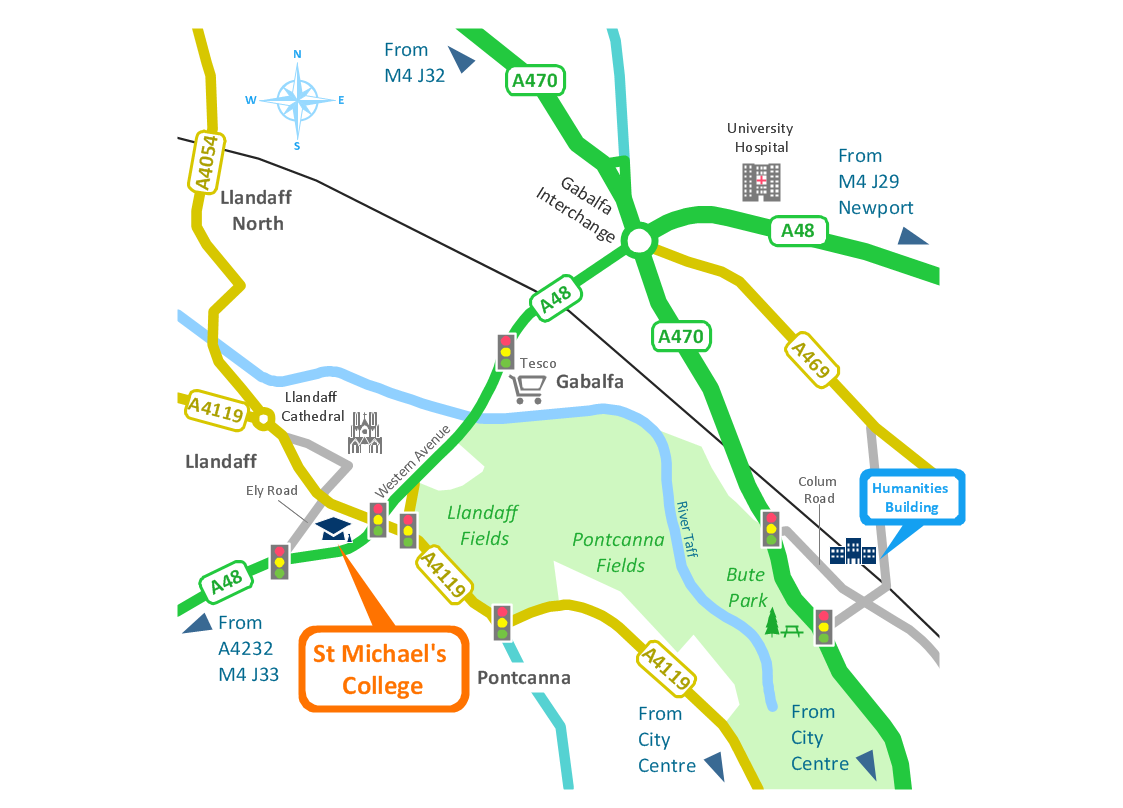
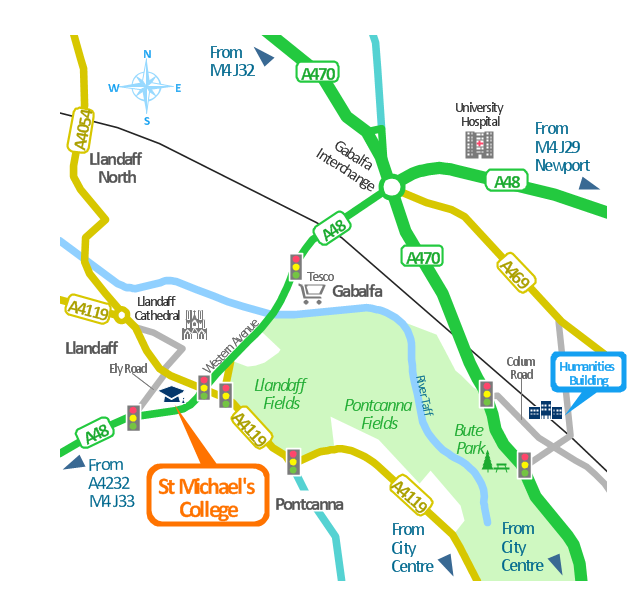
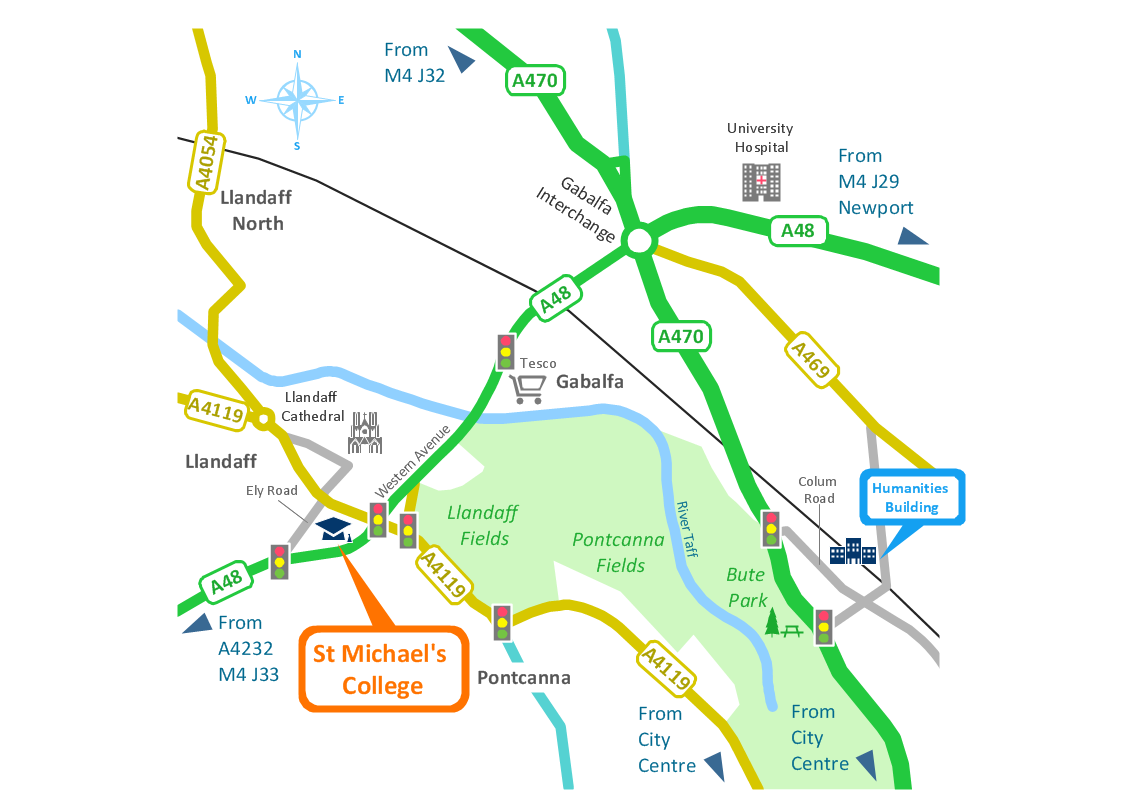
ConceptDraw DIAGRAM is a software for making infographics illustrations. You can work with various components to build really impressive and easy-to-understand infographics design.This spatial infographics was created on the bese of the conference centre location map from the website. [cf.ac.uk/ share/ research/ centres/ clarc/ newsandevents/ isns-conference-2013-booking-information.html]
"The terms location and place in geography are used to identify a point or an area on the Earth's surface or elsewhere. The term location generally implies a higher degree of certainty than place, which often indicates an entity with an ambiguous boundary, relying more on human/ social attributes of place identity and sense of place than on geometry.
Types of location/ place.
(1) A relative location is described as a displacement from another site...
(2) A locality is likely to have a well-defined name but a boundary which is less well defined and which varies by context." [Location (geography). Wikipedia]
The spatial infographics example "Conference centre location map" was created using the ConceptDraw PRO diagramming and vector drawing software extended with the Spatial Infographics solution from the area "What is Infographics" of ConceptDraw Solution Park.
Learning with MindMap
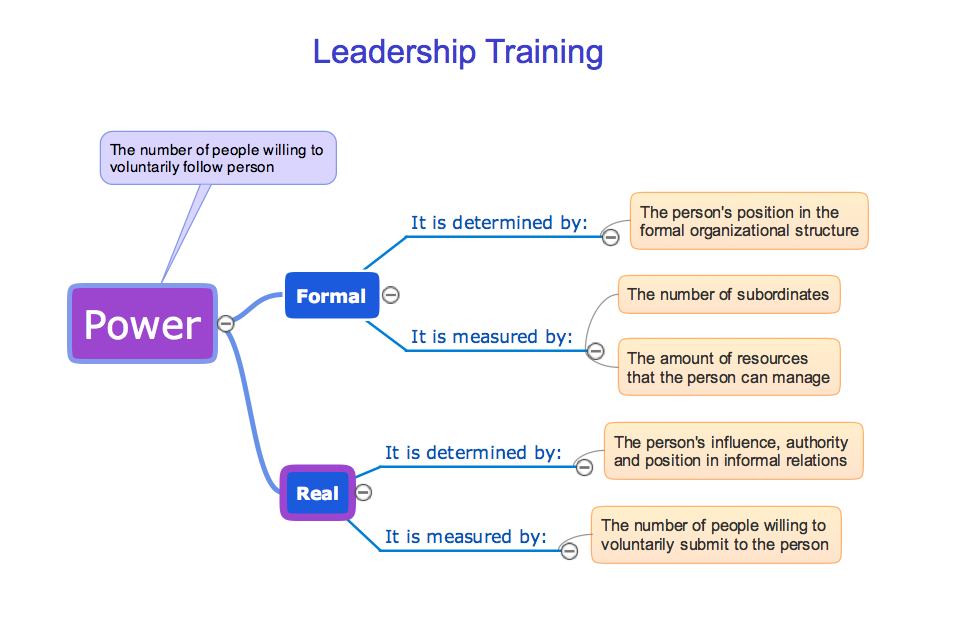
Mind Maps are the simplest way to organize your ideas and information, that's why they are very popular in almost all areas of life and activity, particularly in education area. Learning with Mind Maps is easy, interesting and effective, they help lecturers and teachers to keep the attention of students, to make their lectures relevant and interesting. ConceptDraw MINDMAP is an ideal software for the learning process. It contains great tools for all activities from the organizing to accomplishing the learning process. These tools will help you easy design the learning MindMaps, prepare different learning materials, lectures and lessons plans, make presentations and comprehensive visual illustrations that will provide better understanding and memorizing of new material by the students, provide trainings and brainstorming for effectively collecting and organizing ideas. Mind Maps are also useful and effective in self learning and organizing the distance learning for the team, they help in problem solving, in testing knowledge of students, and much more.Brilliant Examples of Infographics Map, Transport, Road
ConceptDraw DIAGRAM contains spatial infographics samples, map templates to be filled in, and libraries of vector stencils for main design elements of spatial infographics.- Types of Map - Overview | Map Infographic Design | How tо ...
- Map Infographic Design | Spatial infographics Design Elements ...
- Location Map Diagram
- Conference centre location map | How to Draw a Map of North ...
- How tо Represent Information Graphically | Brilliant Examples of ...
- Spatial infographics Design Elements: Transport Map | Spatial ...
- Location Intelligence Dashboard - New European Customers | Maps ...
- Spatial infographics Design Elements: Location Map | Design ...
- Spatial infographics Design Elements: Location Map | Brilliant ...
- 3D pictorial street map | How tо Represent Information Graphically ...
