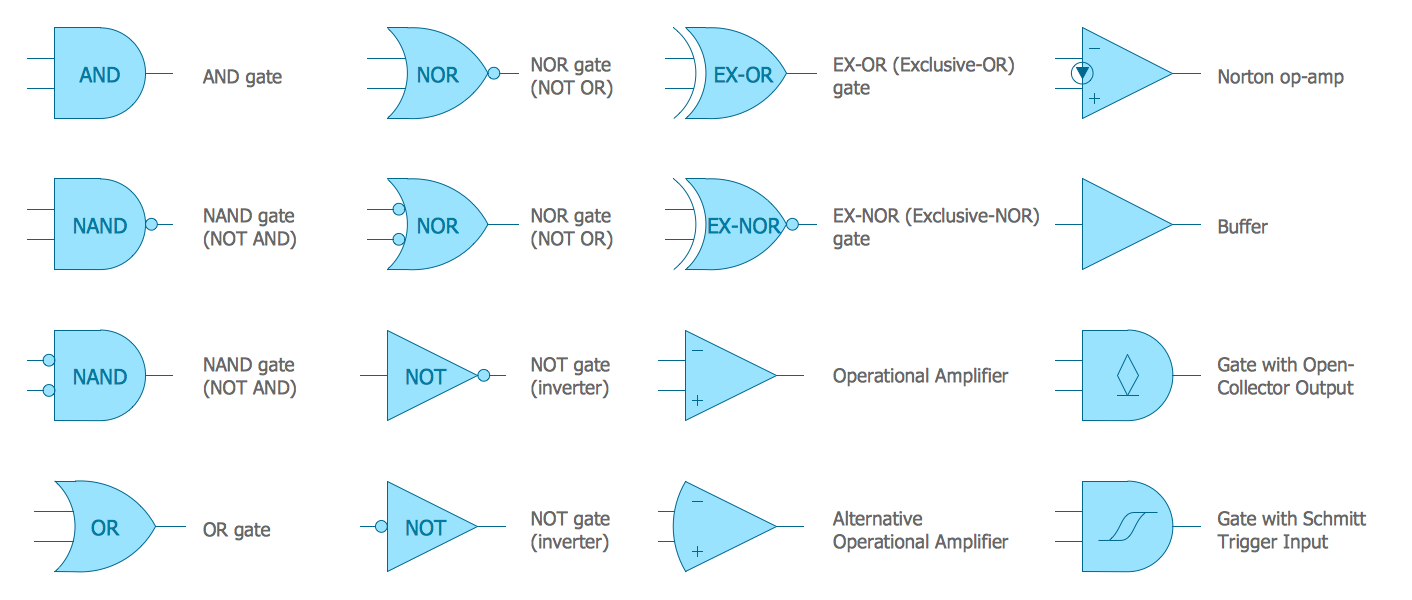
Electrical Symbols — Logic Gate Diagram
In electronics, a logic gate is an idealized or physical device implementing a Boolean function; that is, it performs a logical operation on one or more logical inputs, and produces a single logical output. Depending on the context, the term may refer to an ideal logic gate, one that has for instance zero rise time and unlimited fan-out, or it may refer to a non-ideal physical device 26 libraries of the Electrical Engineering Solution of ConceptDraw DIAGRAM make your electrical diagramming simple, efficient, and effective. You can simply and quickly drop the ready-to-use objects from libraries into your document to create the electrical diagram.Network Diagram Software Logical Network Diagram
Perfect Network Diagramming Software with examples of LAN Diagrams. ConceptDraw Network Diagram is ideal for network engineers and network designers who need to draw Logical Network diagrams.
Circuits and Logic Diagram Software
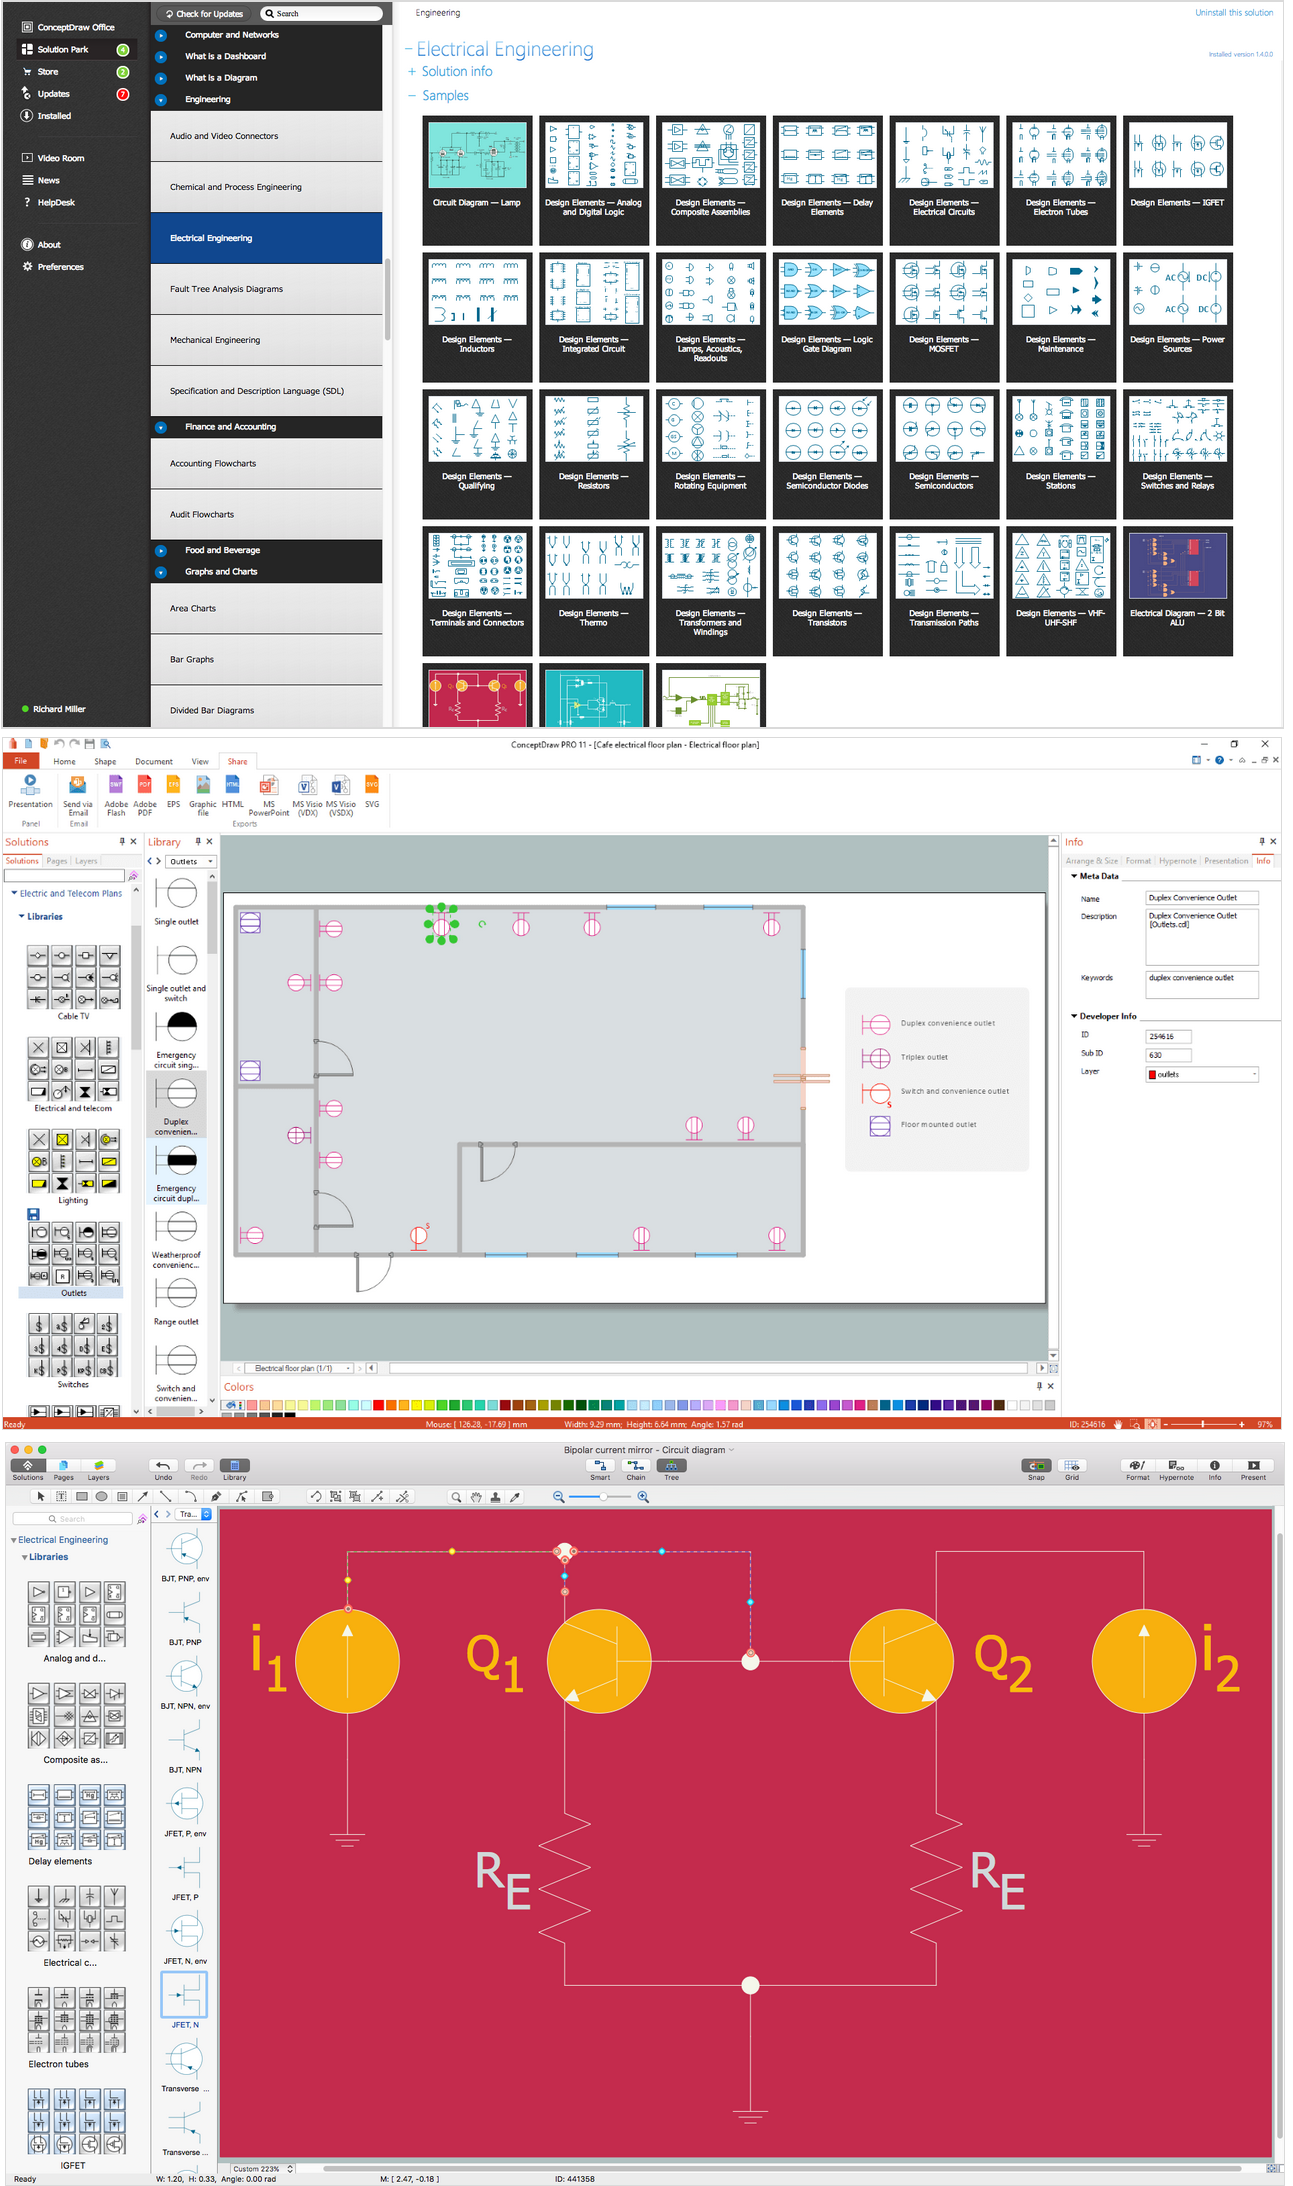
Circuit diagram is a graphical representation of electrical circuits, wire connections between devices, among them power and signal connections. Circuit diagrams are successfully used during design, construction and maintenance of different electrical and electronic equipment, and also for visualizing expressions using a boolean algebra in the computer science. These diagrams don't show a physical arrangement of components. One of advanced application of ConceptDraw DIAGRAM software is electrical engineering. Included to ConceptDraw Solution Park, Electrical Engineering solution from the Engineering area offers templates, samples and incredibly large quantity of vector design elements of circuits and logic symbols, which are helpful for professional drawing Circuit diagrams, Logic circuit diagrams, Wiring diagrams, Electrical schematics, Digital and Analog logic designs, Integrated circuit schematics, Circuit board and Amplifier diagrams, Power systems diagrams, Maintenance and Repair diagrams of any difficulty.Venn Diagram Examples for Problem Solving. Venn Diagram as a Truth Table
Venn diagrams are illustrations used in the branch of mathematics known as set theory. They show the mathematical or logical relationship between different groups of things (sets). A Venn diagram shows all the possible logical relations between the sets.Basic Circles Venn Diagram. Venn Diagram Example
Venn Diagrams visualize all possible logical relations between several sets and are widely used in mathematics, logic, statistics, marketing, sociology, etc. This Venn Diagram shows the relative complement of the set A with respect to the set B. It is the set of the elements in B, but not in A. In other words it is the set-theoretic difference B-A."Logical topology, or signal topology, is the arrangement of devices on a computer network and how they communicate with one another. How devices are connected to the network through the actual cables that transmit data, or the physical structure of the network, is called the physical topology. Physical topology defines how the systems are physically connected. It represents the physical layout of the devices on the network. The logical topology defines how the systems communicate across the physical topologies.
Logical topologies are bound to network protocols and describe how data is moved across the network. ...
EXAMPLE : twisted pair Ethernet is a logical bus topology in a physical star topology layout. while IBM's token ring is a logical ring topology, it is physically set up in star topology." [Logical topology. Wikipedia]
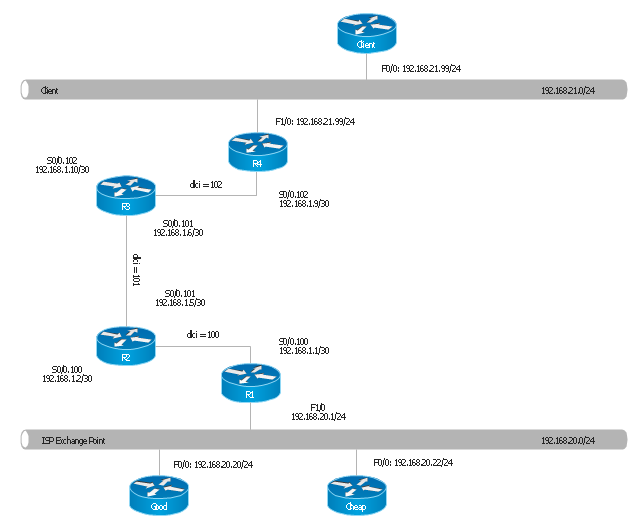
This Cisco logical computer network diagram example was created using the ConceptDraw PRO diagramming and vector drawing software extended with the Cisco Network Diagrams solution from the Computer and Networks area of ConceptDraw Solution Park.
Wiring Diagrams with ConceptDraw DIAGRAM
A Wiring Diagram is a comprehensive schematic that depicts the electrical circuit system, shows all the connectors, wiring, signal connections (buses), terminal boards between electrical or electronic components and devices of the circuit. Wiring Diagram illustrates how the components are connected electrically and identifies the wires by colour coding or wire numbers. These diagrams are necessary and obligatory for identifying and fixing faults of electrical or electronic circuits, and their elimination. For designing Wiring Diagrams are used the standardized symbols representing electrical components and devices. ConceptDraw Solution Park offers the Electrical Engineering solution from the Engineering area with 26 libraries of graphics design elements and electrical schematic symbols for easy drawing various Wiring Diagrams, Electrical Circuit and Wiring Blueprints, Electrical and Telecom schematics of any complexity, Electrical Engineering Diagrams, Power Systems Diagrams, Repair Diagrams, Maintenance Schemes, etc. in ConceptDraw DIAGRAM software.Business process Flow Chart — Event-Driven Process chain (EPC) diagrams
Event-Driven Process chain Diagrams for improvement throughout an organisation. Best software for Process Flow Diagram. The Event-driven Process Chain (EPC) Diagrams allows managers to plan processes and resources.Network Diagram Software Logical Network
ConceptDraw Network Diagram is ideal for network engineers and network designers who need to draw Logical Network diagrams.
Functional Block Diagram
You need design the Functional Block Diagram and dream to find the useful tools to draw it easier, quickly and effectively? ConceptDraw DIAGRAM offers the Block Diagrams Solution from the "Diagrams" Area which will help you!- Element Of Logic Symbol Diagram
- Circuits and Logic Diagram Software | Electrical Symbols — Logic ...
- Design elements - Logic gate diagram | Symbol Amplifier Diagram
- Design elements - Logic gate diagram | Design elements - Analog ...
- Design elements - Logic gate diagram | Design elements - Venn ...
- Design elements - Logic gate diagram | Draw The Logic Gate Symbol
- Digital Logic Diagram Tool
- Example Of Network Logic Diagram
- Logic gate diagram - Template | Electrical Symbols — Logic Gate ...


