Business process Flow Chart — Event-Driven Process chain (EPC) diagrams
Event-Driven Process chain Diagrams for improvement throughout an organisation. Best software for Process Flow Diagram. The Event-driven Process Chain (EPC) Diagrams allows managers to plan processes and resources.Data Flow Diagram Model
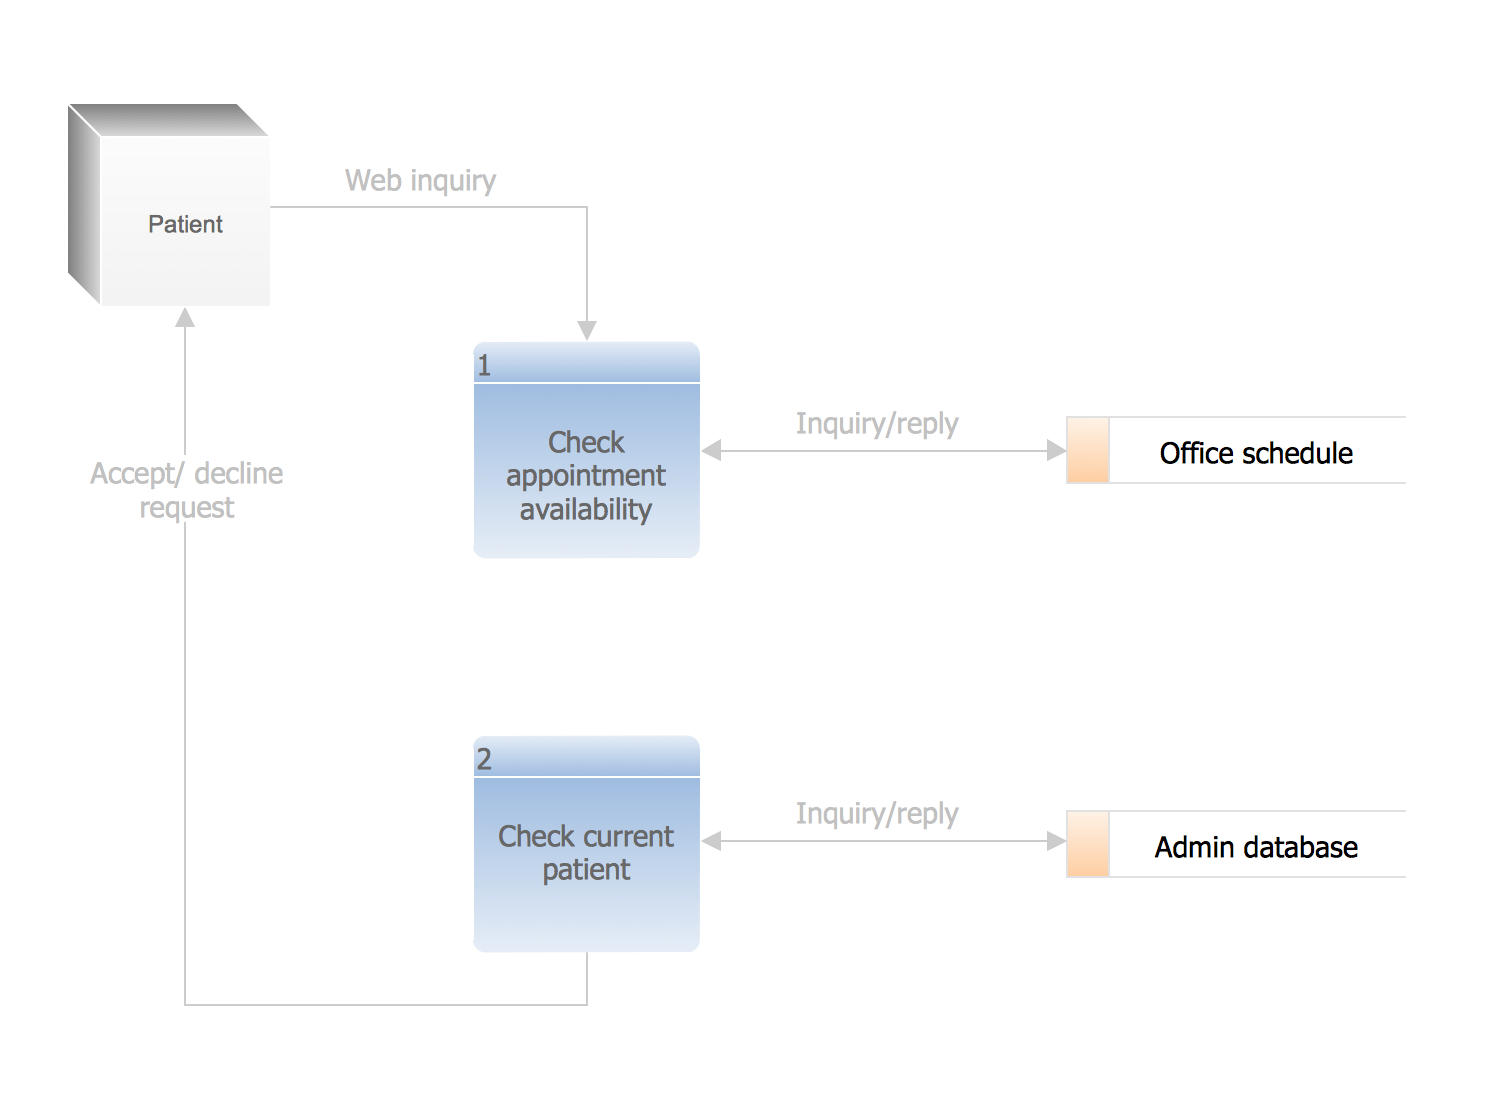
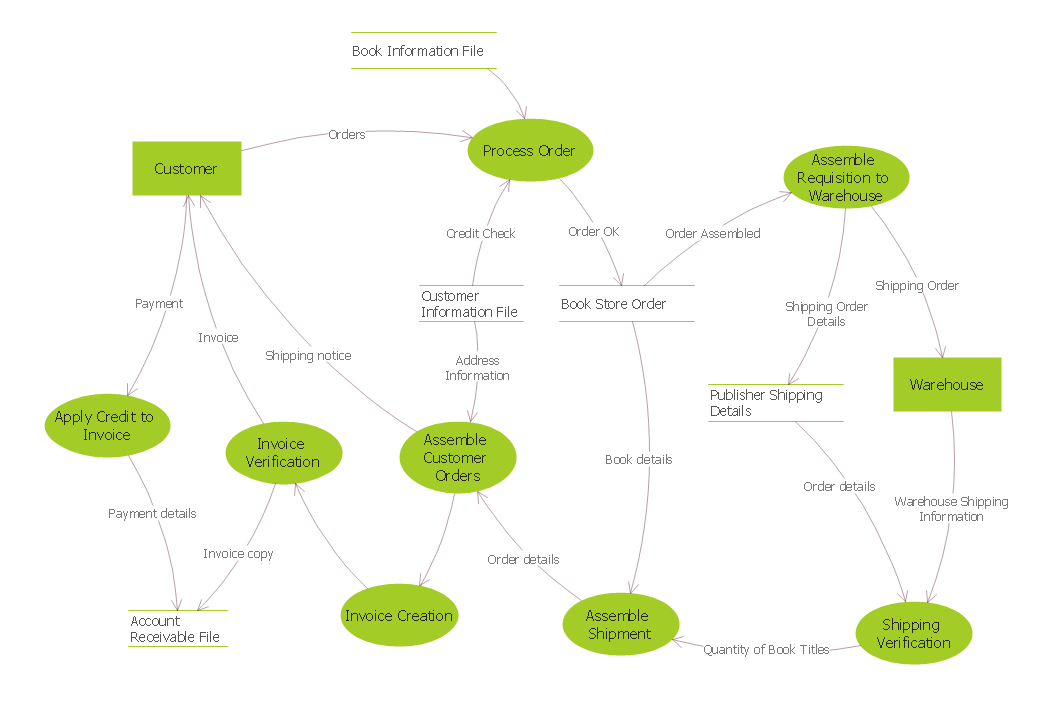
Data Flow Diagram (DFD) is a technique of graphical structural analysis, describing the sources external to the system, recipients of data, also logical functions, data flows and data stores that are accessed. The DFD's goal is to show how each process converts its inputs into the outputs and to identify relationships between these processes, at this make the system's description clear and understandable at every level of detail. Historically happened that for describing Data Flow Diagrams are used two notations - Yourdon and Gane-Sarson that differ each from other by graphical representation of symbols. The DFD model, like most other structural models is a hierarchical model. Each process can be subjected to decomposition on the structural components, the relationships between which in the same notation can be shown on a separate diagram. Typically, several DFD models are built when modeling the system. ConceptDraw DIAGRAM software enhanced with Data Flow Diagrams solution ideally suits for creation DFD models and professional drawing Data Flow Diagrams.Active Directory Diagram
Active Directory (AD) is a directory management service introduced by Microsoft Corporation for Windows domain networks. This service uses the Lightweight Directory Access Protocol (LDAP) and provides quick access to the included information about large structural units such as domains, organizational units, sites, and also about simple objects, such as users names with detailed information about them - contacts information, access rights, etc. Active Directory Diagram is a representation of the network structure in clear graphical format. It is a scheme of correlations of service components with preset degree of detailed elaboration. Active Directory Diagram makes the work of network administrators with Active Directory network structure more easy and convenient, allows plan and service the network quicker and more qualitatively. The help of ConceptDraw DIAGRAM software extended with Active Directory Diagrams solution from the Computer and Networks area is indispensable for easily and quickly creation the highly detailed Active Directory Diagrams.Gane Sarson Diagram
The Gane-Sarson methodology uses the graphical techniques for building the logical models for the systems. It is helpful for analysts and designers to make common and clear picture of the system, to depict all its processes and how they transform the data. The Gane-Sarson methodology lets represent all this information in a way understandable for the users and other interested people, and gives the possibility to see instantly how the system's parts serve together to meet their needs. This methodology supposes the building of a system top-down. First you need create an overall system data flow, then determine the details of the data structures, the process logic and design the modular structures. ConceptDraw DIAGRAM diagramming and vector drawing software offers the Data Flow Diagrams solution with Gane-Sarson Notation library rich for the specific symbols of the Gane-Sarson notation. All they are vector and fully ready-to-use for drawing the Data Flow Diagrams, which will be then successfully used in presentations, websites, and various business documents.Data Flow Diagrams
Data Flow Diagram (DFD) is a special chart type which lets graphically illustrate the "flow" of data through an information system. So the Data Flow Diagrams can be successfully used for visualization of data processing or structured design, for creation an overview of the system, for business process modeling, for exploring the high-level design in terms of data flows and documenting the major data flows. Inclusion of powerful Data Flow Diagrams solution to the Software Development area of ConceptDraw Solution Park makes the ConceptDraw DIAGRAM a beneficial data flow diagramming software and supplies it with numerous collection of quick-start templates, professionaly designed samples, and extensive range of ready-for-use vector objects consisting the Data Flow Diagrams, Gane-Sarson Notation, and Yourdon and Coad Notation libraries. Use the ConceptDraw DIAGRAM application to design easy and quickly the Data Flow Diagrams including the data storages, data flows, external entities, functional transforms, control transforms and signals.ConceptDraw DIAGRAM UML Diagrams with ConceptDraw DIAGRAM
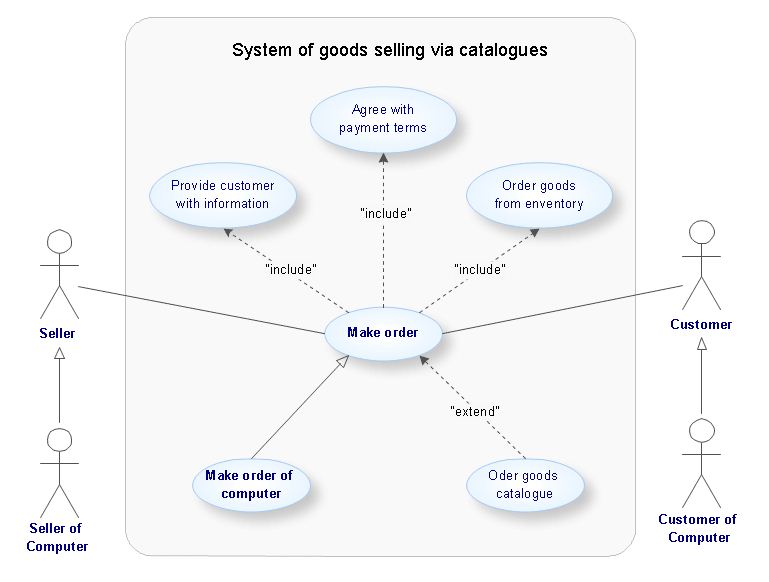
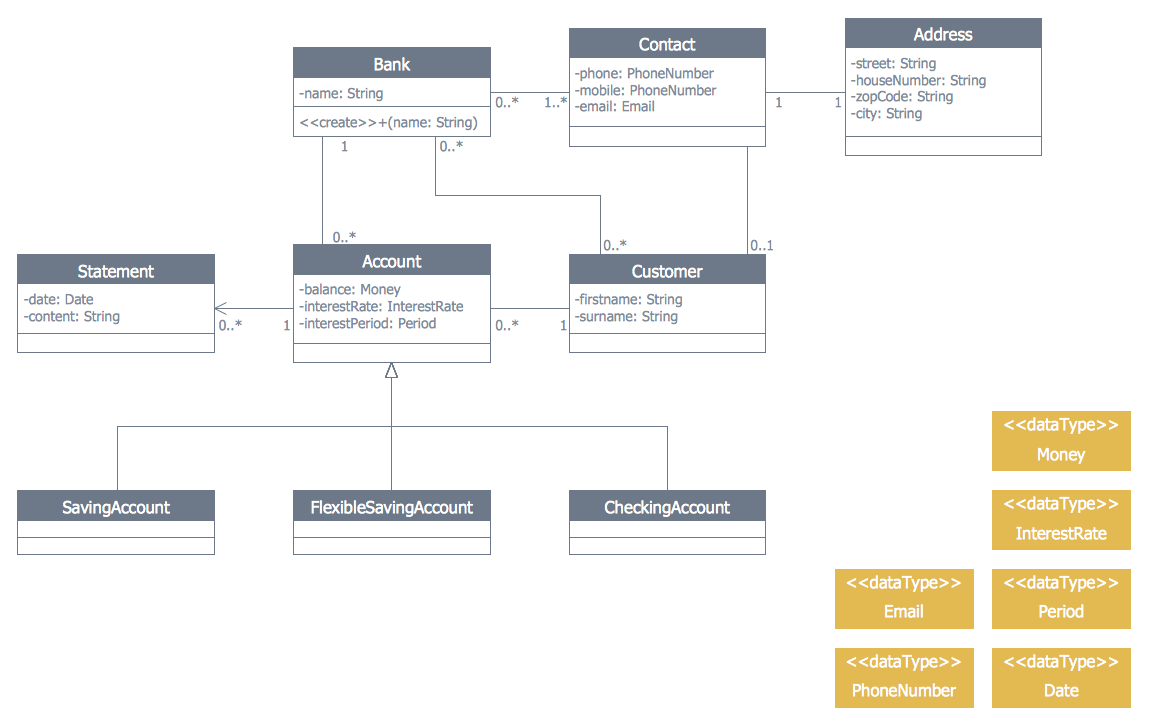
ConceptDraw DIAGRAM is a great UML modeling and design tool that enables you to quickly and easily generate all types of UML diagrams. ConceptDraw DIAGRAM offers a large collection of industry-standard UML object libraries for all types of UML diagrams.How to Help Customers be More Productive
Presenting you with a drawing program which could really surprise you with their great functionality. Don't know how to start to draw Connector's improvement? Curious how should diagramming software work? Drawing programs involve a lot of things like designs in an illustrative way, creating an cherts, Tools to create high end graphics, create dashboards, using your data and many other technical aspects do it in a much professional and in a quick way.Diagramming Software for Design UML Communication Diagrams
UML Communication Diagram depicts the interactions between objects or parts in terms of sequenced messages and describes both the static structure and dynamic behavior of a system.
ConceptDraw Arrows10 Technology
How should diagramming software work? The answer is - Fast and easy. "Tree"- mode drawing works like that. Just select objects in your drawing and press Tree or Chain button to connect all of them just in one click. Your diagram looks professional and it took only a moment to draw.
 Data Flow Diagrams (DFD)
The use of Data Flow Diagrams (DFD) solution as an extension to the ConceptDraw DIAGRAM tool can simplify its users’ work by creating any necessary Data Flow Diagram, which can help simulate multiple data flows and illustrate the functional requirements of the system or business process. Using the pre-made templates and samples of the DFDs, and as the stencil libraries full of DFD-related design elements, any ConceptDraw DIAGRAM user might find the Data Flow Diagrams (DFD) solution a useful tool for making the needed DFD drawings.
SysML Diagram
To draw SysML diagrams use the ConceptDraw DIAGRAM diagramming and vector drawing software extended with the Rapid UML solution from the Software Development area of ConceptDraw Solution Park.Cross-functional flowchart landscape, U.S. units
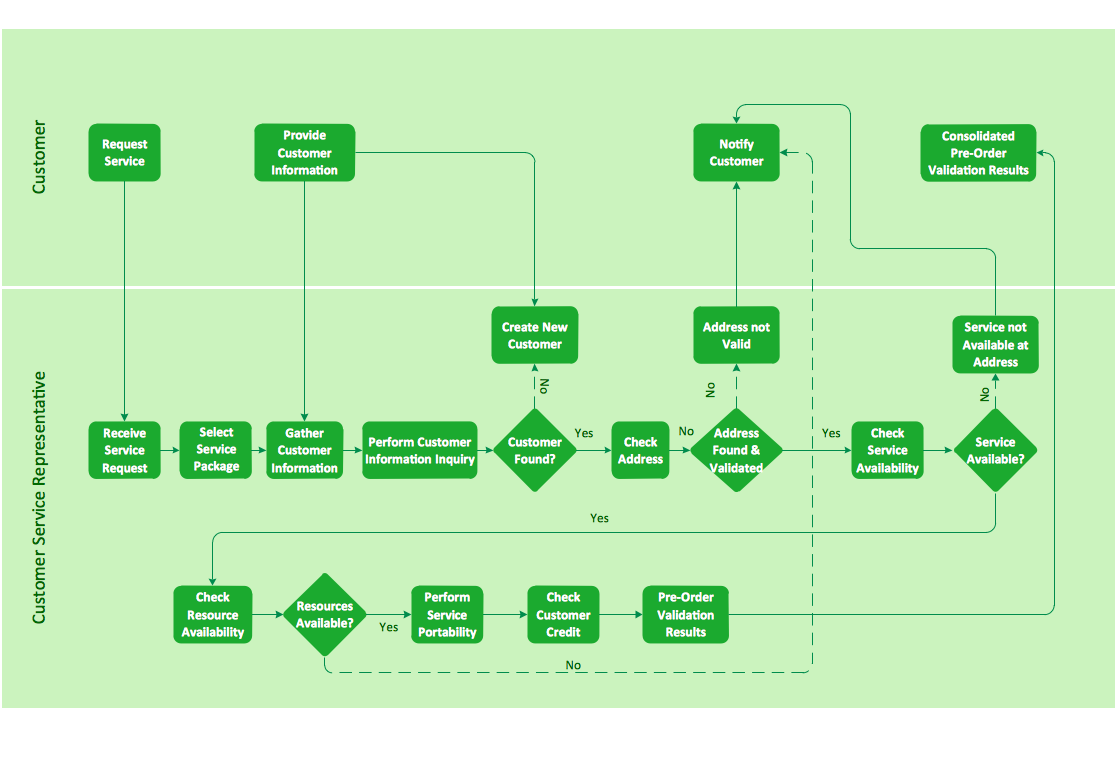
In Cross-Functional Flowchart first step is to determine how many lanes you want to represent and what the lane titles will be. The choice of vertical or horizontal swim lanes landscape comes down to personal choice or just plain “what fits best”. With ConceptDraw, we make that simple by including different swim lanes templates. Professional looking examples and templates of Swimlane Flowchart which help you create Cross Functional Flowcharts rapidly.Organizing and Selecting Social Media Response Action
Interactive tool helps you find the appropriate response to social media mentions quickly.Circle Spoke Diagram Template
ConceptDraw DIAGRAM diagramming and vector drawing software offers the Circle Spoke Diagram Template included in the Business Diagrams Solution from the Management Area. The use of ready template is the easiest way of drawing professional-looking Circle-Spoke Diagrams. Flowchart Design Flowchart Symbols, Shapes, Stencils and Icons
A flowchart is a type of diagram which represents an algorithm, process or workflow, displays the steps as boxes of various kinds and depicts their order by connecting them with arrows. Any business graphic document will be more colorful and understandable if will use professional-looking and visual diagrams and flowcharts. Flowchart design gives versatile presenting and explaining of the process.
ConceptDraw DIAGRAM flowchart software enhanced with Flowcharts solution helps effectively make Flowchart Design. Use of predesigned flowchart symbols and bright color palette offers a fresh view and favorably distinguishes the flowcharts designed in ConceptDraw DIAGRAM from the black and white flowcharts on a paper. Preferably to use no more than three or four colors and apply identical for the same shape types. The best flowchart design can be achieved by starting with Flowchart template, or any of suitable ready examples or samples offered in ConceptDraw STORE, open one of them and enter the proper text into each Flowchart shape.
Each symbol of the flowchart has a definition that can't be changed. This means that all flowcharts shapes can be grouped in according to their meaning. Users with ConceptDraw DIAGRAM flowchart software can style groups of symbols with close definitions by color sets chosen from complementary palette.
Almost all workflows can be depicted as a flowchart. Colored diagrams are more light for perception of the certain information, this is part of flowchart design. Bright colors need to be used in the key points of Decision symbols, to focus attention on their importance for whole process flow.

Process Engineering
ConceptDraw DIAGRAM diagramming and vector drawing software supplied with Chemical and Process Engineering Solution from the Industrial Engineering Area of ConceptDraw Solution Park is powerful and effective process engineering software.Banking System
ConceptDraw DIAGRAM extended with ATM UML Diagrams Solution from the Software Development Area of ConceptDraw Solution Park is a powerful software for representing the ATM processes, for designing and building banking system and ATMs.Cross Functional Flowchart Symbols
The excellent possibility to create attractive Cross Functional Flowcharts for step-by-step visualization the operations of a business process flow of any degree of detailing is offered by ConceptDraw’s Cross-Functional Flowcharts solution. The extensive selection of commonly used vector cross functional flowchart symbols allow you to demonstrate the document flow in organization, to represent each team member’s responsibilities and how processes get shared or transferred between different teams and departments.UML Composite Structure Diagram. Design Elements
UML Composite Structure Diagram shows the internal structure of a class and the possible interactions at this structure. ConceptDraw has 393 vector stencils in the 13 libraries that helps you to start using software for designing your own UML Diagrams. You can use the appropriate stencils of UML notation from UML Composite Structure library.How To Draw a Diagram
Is it possible to draw a diagram as quickly as the ideas come to you? The innovative ConceptDraw Arrows10 Technology included in ConceptDraw DIAGRAM is a simple and powerful tool to create any type of diagram. You mau choose to start from one of plenty diagram templates or to use your own idea.- Gane Sarson Diagram | Gane Sarson Tutorial
- Business Process Modeling Resume | How To Use Ssadm Tutorial Pdf
- Data Flow Diagram (DFD) | UML Class Diagram Tutorial
- Structured Systems Analysis and Design Method (SSADM) with ...
- Structured Systems Analysis and Design Method (SSADM) with ...
- How to Create an IDEF0 Diagram for an Application Development ...
- Diagramming Software for Design UML Interaction Overview ...
- Entity-Relationship Diagram (ERD) | Erd Examples Tutorials
- Data Flow Diagram Example | Yourdon And Coad Notation Visio
- Process Flowchart | Cross-Functional Flowcharts | An Event-driven ...


