HelpDesk
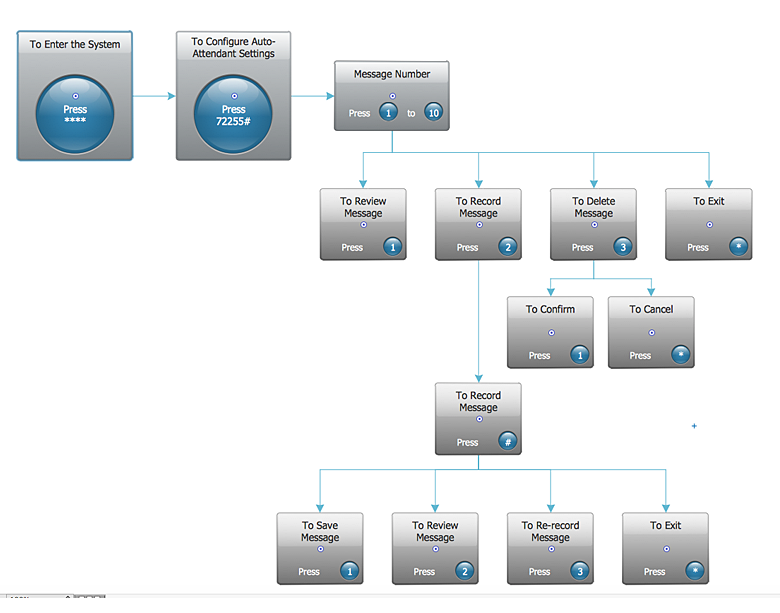
How to Create an Interactive Voice Response (IVR) Diagram in ConceptDraw PRO
Interactive Voice Response (IVR) Diagram is used to create and conduct the Interactive Voice Response systems for call-centers and voice mail services. IVR diagrams intended to visualize the logical and physical structure of Interactive voice response systems. ConceptDraw solution for Interactive Voice Response (IVR) Diagram allows you to create and communicate the Interactive Voice Response diagram of any complexity. Interactive Voice Response (IVR) System is a telecommunication technology that enables a computer to automatically process voice and touch phone signals. IVR systems allows users to interact through a computer with various service systems, available by telephone. The objective of IVR system is to reduce customer service costs by delivering self service to customers and guiding them to the information that they look for.HelpDesk
Event-driven Process Chain (EPC) Diagram Software
An EPC diagram is a type of flowchart used in business process analysis. It shows different business processes through various work flows. The workflows are shown as processes and events that are related to different executes and tasks that allow business workflow to be completed. An EPC diagram shows different business processes through various workflows. The workflows are seen as functions and events that are connected by different teams or people, as well as tasks that allow business processes to be executed. The best thing about this type of enterprise modelling is that creating an EPC diagram is quick and simple as long as you have the proper tool. One of the main usages of the EPC diagrams is in the modelling, analyzing and re-engineering of business processes. With the use of the flowchart, businesses are able to see inefficiencies in the processes and modify to make them more productive. Event-driven process chain diagrams are also used to configure an enterprise resource plaHelpDesk
How to Create a Fault Tree Analysis Diagram (FTD) in ConceptDraw PRO
Fault Tree Diagram are logic diagram that shows the state of an entire system in a relationship of the conditions of its elements. Fault Tree Diagram are used to analyze the probability of functional system failures and safety accidents. ConceptDraw PRO allows you to create professional Fault Tree Diagrams using the basic FTD symbols. An FTD visualize a model of the processes within a system that can lead to the unlikely event. A fault tree diagrams are created using standard logic symbols . The basic elements in a fault tree diagram are gates and events.HelpDesk
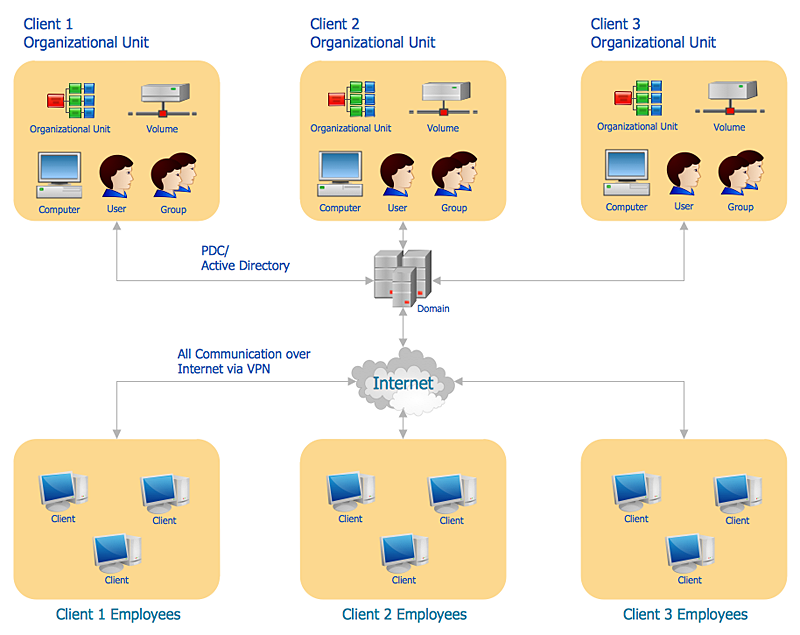
How to Create an Active Directory Diagram in ConceptDraw PRO
Active Directory Service represents a distributed database that contains all the domain objects. The Active Directory domain environment is a single point of authentication and authorization of users and applications across the enterprise. The domain of the organization and deployment of Active Directory Service are exactly the cornerstones of the enterprise IT infrastructure. The logical diagrams of MS Windows Active Directory structure are used to visually support an enterprise IT infastructure planning and management. ConceptDraw PRO allows you to make AD Diagrams quickly and easily using the set of special libraries.
 Computer Network Diagrams
Computer Network Diagrams solution extends ConceptDraw PRO software with samples, templates and libraries of vector stencils for drawing the computer network topology diagrams.
HelpDesk
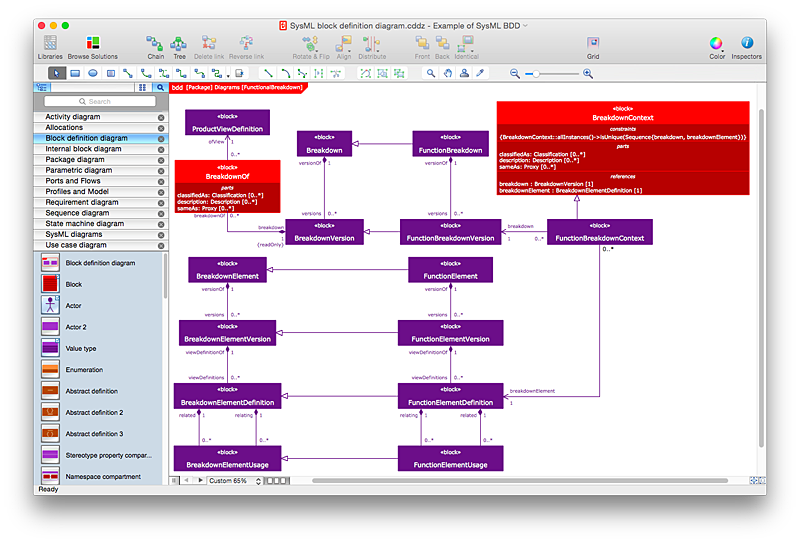
How to Create a SysML Diagram Using ConceptDraw PRO
Systems Modeling Language (SysML) is designed to use for system engineering. It is similar to UML, but much easier to learn. used by to system engineers what UML is to software engineers. Smaller in content and simpler to learn than UML. SysML is focused on standardizing the language used to describe engineering systems. SysML covers a broader range of systems, than can involve personnel, facilities, hardware or electrical components. SysML depicts system using the SysML diagrams. Making a SysML diagram involves many elements that can be managed using SysML solution for ConceptDraw PRO.HelpDesk
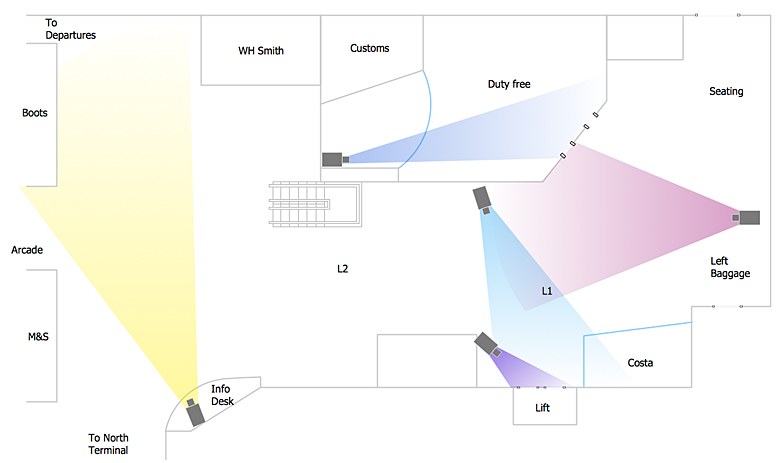
How to Create a CCTV Diagram in ConceptDraw PRO
CCTV (Closed circuit television) diagram is used to depict a system of video monitoring. The CCTV diagram provides video cameras placement strategy. CCTV diagram should include the scheme of strategic placement of video cameras, which capture and transmit videos to either a private network of monitors for real-time viewing, or to a video recorder for later reference. CCTV is commonly used for surveillance and security purposes. Using ConceptDraw PRO with the Security and Access Plans Solution lets you create professional looking video surveillance CCTV system plans, security plans, and access schemes.HelpDesk
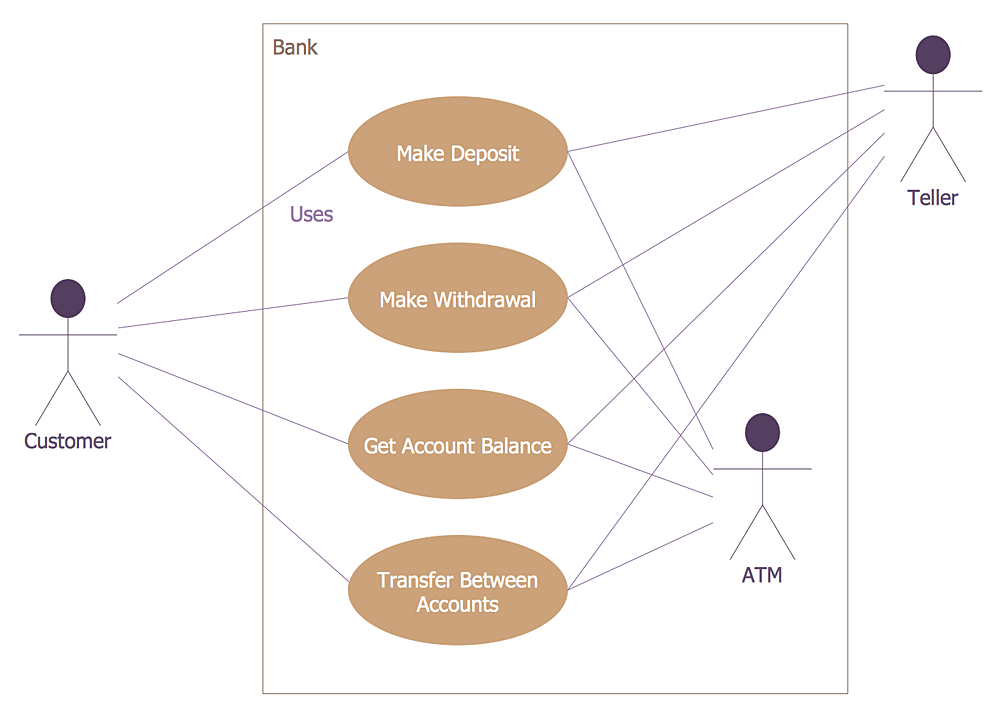
How to Create a Bank ATM Use Case Diagram
UML diagrams are often used in banking management for documenting a banking system. In particular, the interaction of bank customers with an automated teller machine (ATM) can be represented in a Use Case diagram. Before the software code for an ATM, or any other system design, is written, it is necessary to create a visual representation of any object-oriented processes. This is done most effectively by creating a Unified Modeling Language (UML) diagram, using object-oriented modeling. UML works as a general purpose modeling language for software engineers or system analysts, offering a number of different diagram styles with which to visually depict all aspects of a software system. ConceptDraw PRO diagramming software, enhanced and expanded with the ATM UML Diagrams solution, offers the full range of icons, templates and design elements needed to faithfully represent ATM and banking information system architecture using UML standards. The ATM UML Diagrams solution is useful for beginner and advanced users alike. More experienced users will appreciate a full range of vector stencil libraries and ConceptDraw PRO's powerful software, that allows you to create your ATM UML diagram in a matter of moments.HelpDesk
How to Create a Data Flow Diagram using ConceptDraw PRO
Data flow diagramming is a highly effective technique for showing the flow of information through a system. Data flow diagrams reveal relationships among and between the various components in a program or system. DFD is an important technique for modeling a system’s high-level detail by showing how input data is transformed to output results through a sequence of functional transformations. The set of standard symbols is used to depict how these components interact in a system. ConceptDraw PRO allows you to draw a simple and clear Data Flow Diagram using special libraries.
 Rapid UML
Rapid UML solution extends ConceptDraw PRO software with templates, samples and libraries of vector stencils for quick drawing the UML diagrams using Rapid Draw technology.
HelpDesk
How to Draw a Block Diagram in ConceptDraw PRO
Block diagram is a simple chart that use blocks to show some elements or activities, and connectors that show the relationship between neighboring blocks. They are commonly simple, giving an overview of a process without necessarily going into the specifics of implementation. Block diagrams are commonly used to depict a general description of a system and its activity. A most known sample of a block diagram is a flow chart, used in many types of business as a common method of representing repeated processes. Easy and a simple creation, a number of objects and connectors make the block diagram a many-sided tool for various industries. The ability to make block diagrams is delivered by the ConceptDraw Block Diagrams solution.HelpDesk
How to Create an ERD Diagram
ERD (entity relationship diagram) is used to show the logical structure of databases. It represents the interrelationships between components of database (entities). Entity relationship diagrams are a widely used in software engineering. Using ERD software engineers can control the every aspect of database development. ER diagram can be used as guide for testing and communicating before the release of software product. ERD displays data as entities that are connected with connections that show the relationships between entities. There is some ERD notations used by data bases developers for representing the relationships between the data objects. ConceptDraw PRO and its ERD solution allow you to build ERD diagram of any notation.HelpDesk
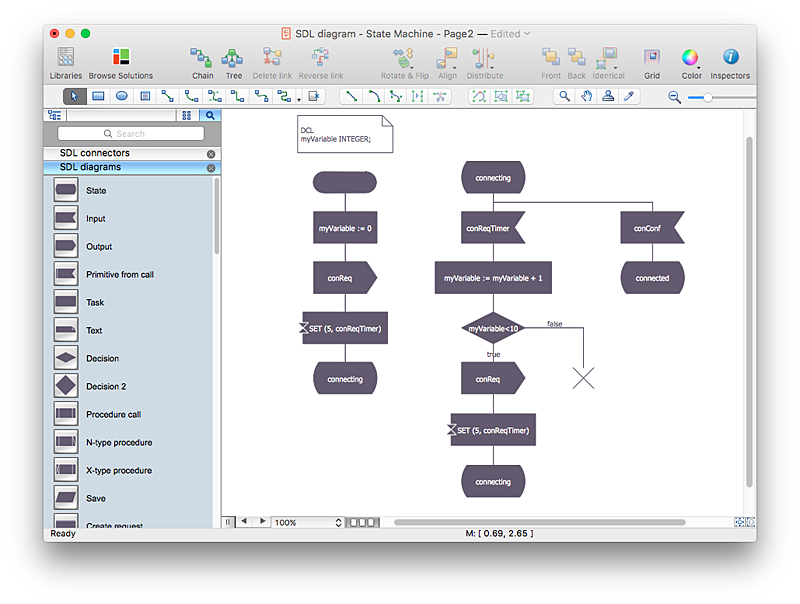
How to Create a SDL Diagram Using ConceptDraw PRO
Specification and Description Language (SDL) is intended to describe systems that switched state often and rapidly. An SDL diagram is a view of system, that can depict a single process, or complex relationships between a number of elements. The SDL diagram supports a nested hierarchy. A system is devided into blocks, each of them can be describes as a process, until finally one can see the initial procedures that make up each process. The advantage of this method is that a system can be viewed in manageable part thatcan be followed separately. ConceptDraw Specification and Description Language solution contains the library, with a SDL notation in a vector stencil graphics. The SDL solution also provides a set of samples, to show the level of hierarchical detail that is possible.- How to Create a UML Diagram Quickly
- How to Create an Interactive Voice Response (IVR) Diagram in ...
- Business Support System Block Diagram
- Video Surveillance For Atm System Er Diagrams
- 5 Level pyramid model diagram - Information systems types
- Customer Support System Uml Diagrams
- 4 Level pyramid model diagram - Information systems types ...
- Block Diagram For Business Support System
- Customer Support System Class Diagram Diagram
- Top-level context diagram | How to Create a Fault Tree Analysis ...
- System Context Diagram
- Example of DFD for Online Store (Data Flow Diagram ) DFD ...
- Helpdesk Ticketing System Flowchart
- 5 Level pyramid model diagram - Information systems types | Design ...
- UML activity diagram - Ticket processing system | Process Flowchart ...
- 5 Level pyramid model diagram - Information systems types | How to ...
- Wireless Networks | How to Create a Wireless Network Diagram ...
- Decision Support System Flow Diagram
- It Support Diagram
