 Logistics Flow Charts
Logistics Flow Charts solution extends ConceptDraw DIAGRAM functionality with opportunities of powerful logistics management software. It provides large collection of predesigned vector logistic symbols, pictograms, objects and clipart to help you design with pleasure Logistics flow chart, Logistics process flow diagram, Inventory flow chart, Warehouse flowchart, Warehouse management flow chart, Inventory control flowchart, or any other Logistics diagram. Use this solution for logistics planning, to reflect logistics activities and processes of an enterprise or firm, to depict the company's supply chains, to demonstrate the ways of enhancing the economic stability on the market, to realize logistics reforms and effective products' promotion.
HelpDesk
How to Make a Logistics Flow Chart

 Logistic Dashboard
The powerful tools of Logistic Dashboard solution and specially developed live graphic objects of logistic icons, logistic navigation elements, logistic indicators, logistic charts and logistic maps effectively assist in designing Logistic dashboards, Logistic maps, Logistic charts, diagrams and infographics. The included set of prebuilt samples and quick-start templates, demonstrates the power of ConceptDraw DIAGRAM software in logistics management, its assisting abilities in development, realization and analyzing the logistic processes, as well as in perfection the methods of logistics management.
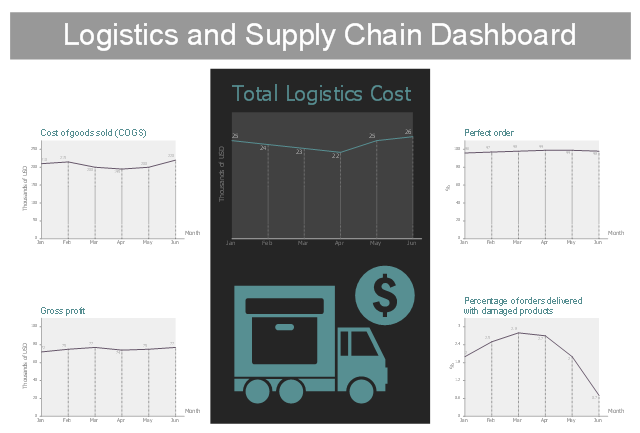
This business dashboard template contains 5 line charts of logistics and supply chain business metrics.
Use it to create your logistic and supply chain dashboard with ConceptDraw PRO software.
The performance dashboard template "Logistics and Supply Chain Dashboard" is included in Logistic Dashboard solution from Business Processes area of ConceptDraw Solution Park.
Use it to create your logistic and supply chain dashboard with ConceptDraw PRO software.
The performance dashboard template "Logistics and Supply Chain Dashboard" is included in Logistic Dashboard solution from Business Processes area of ConceptDraw Solution Park.
Logistic dashboard
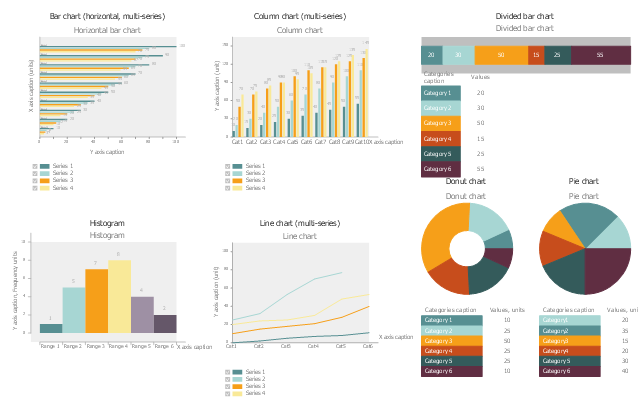
The vector stencil library "Logistic charts" contains 7 graphs: horizontal bar graphs, column chart, divided bar chart, donut chart, histogram, line graph, pie chart.
Use it to design your logistic dashboards with ConceptDraw PRO software.
The graphs example "Design elements - Logistic charts" is included in Logistic Dashboard solution from Business Processes area of ConceptDraw Solution Park.
Use it to design your logistic dashboards with ConceptDraw PRO software.
The graphs example "Design elements - Logistic charts" is included in Logistic Dashboard solution from Business Processes area of ConceptDraw Solution Park.
Graphs
HelpDesk
How to Make a Logistic Dashboard
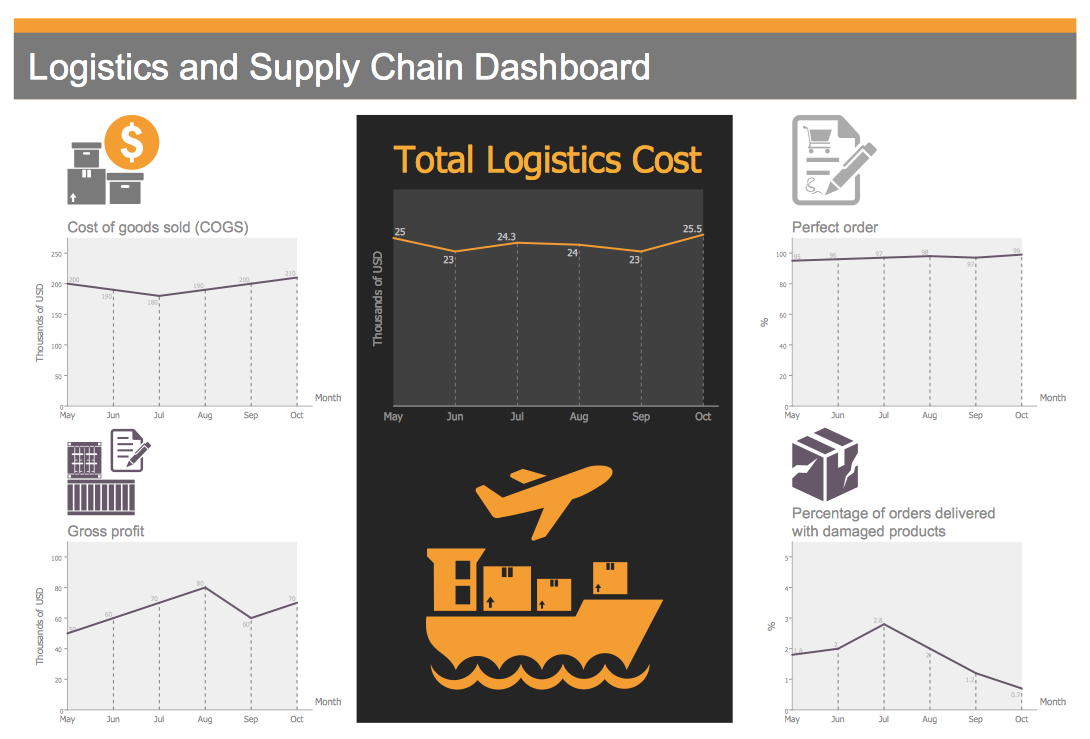
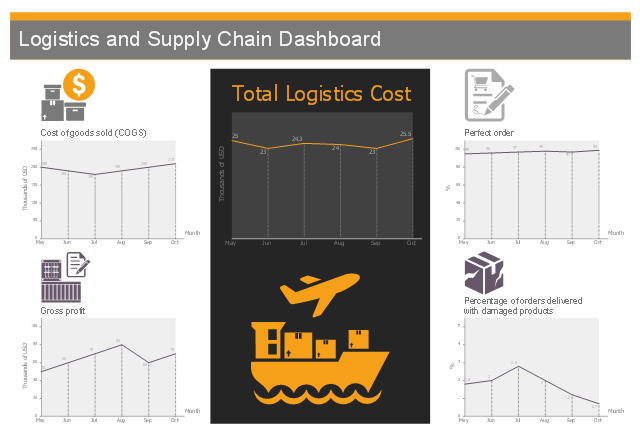
This business dashboard example shows 5 line charts of logistics and supply chain business metrics.
"A supply chain is a system of organizations, people, activities, information, and resources involved in moving a product or service from supplier to customer. Supply chain activities involve the transformation of natural resources, raw materials, and components into a finished product that is delivered to the end customer." [Supply chain. Wikipedia]
The performance dashboard example "Logistics and Supply Chain Dashboard" was designed using ConceptDraw PRO software extended with Logistic Dashboard solution from Business Processes area of ConceptDraw Solution Park.
Logistic dashboard
- Sample Flow Chart For Logistics Processes
- Logistics Flow Charts | Process Flowchart | How to Make a Logistics ...
- Logistics Process Flow Chart Download
- Logistics Flow Charts | Process Flowchart | Bar Diagrams for ...
- Design elements - Logistic finance | Logistics Flow Charts | Design ...
- Logistic Management Flow Chart
- Logistics Flow Charts | Spatial infographics Design Elements ...
- Logistics Flow Charts | Simple Flow Chart | Flowchart Components ...
- Logistics Flow Charts | Material Dispatch Process Flow Chart
- Flow chart Example. Warehouse Flowchart | Logistics ...