 Logistic Dashboard
The powerful tools of Logistic Dashboard solution and specially developed live graphic objects of logistic icons, logistic navigation elements, logistic indicators, logistic charts and logistic maps effectively assist in designing Logistic dashboards, Logistic maps, Logistic charts, diagrams and infographics. The included set of prebuilt samples and quick-start templates, demonstrates the power of ConceptDraw PRO software in logistics management, its assisting abilities in development, realization and analyzing the logistic processes, as well as in perfection the methods of logistics management.
HelpDesk
How to Make a Logistic Dashboard
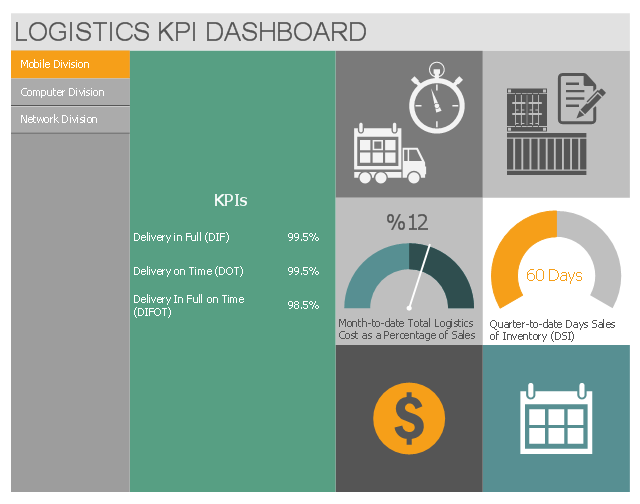
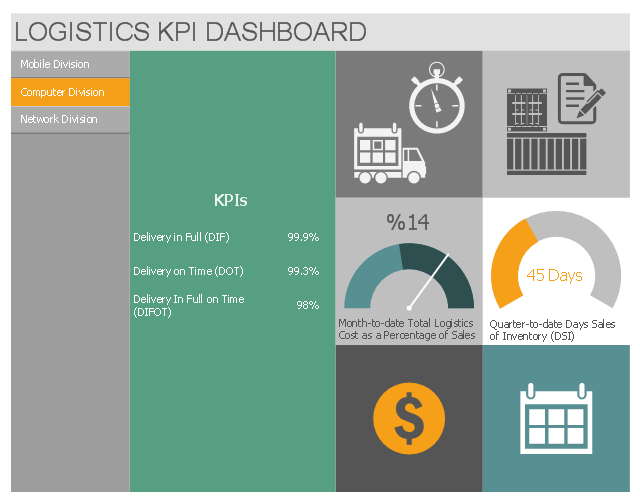
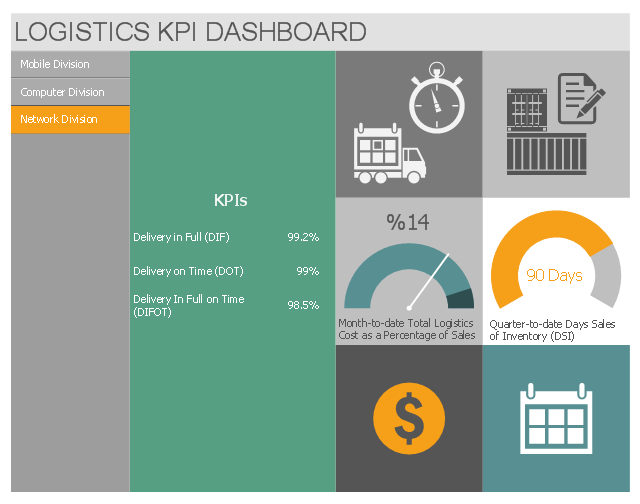
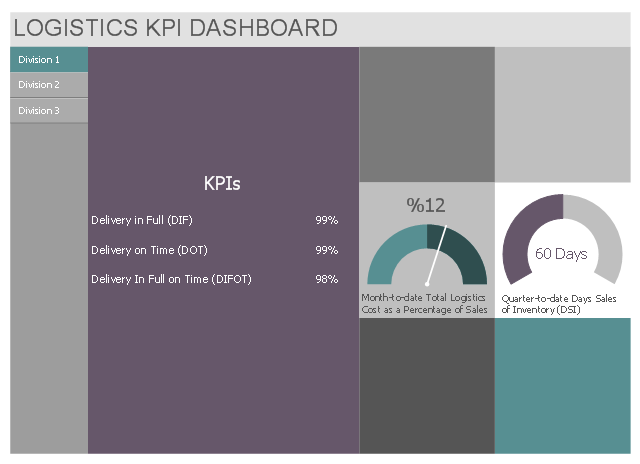
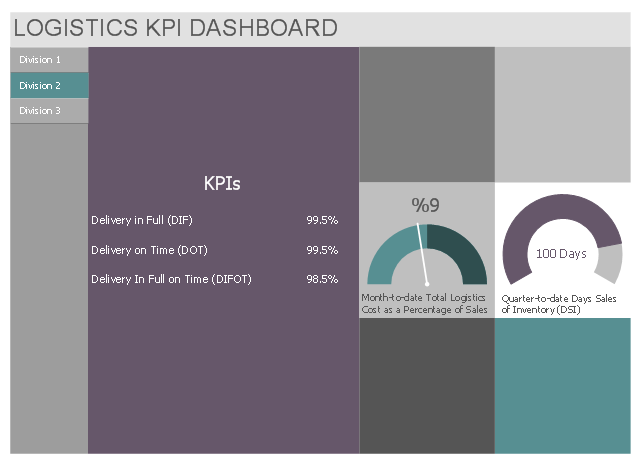
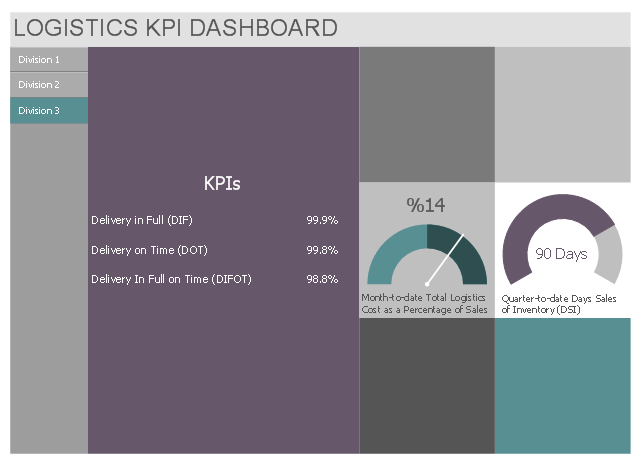
The business data represented in the view of dashboard can show the real picture of the activity of the entire organization, or it can display particular information like website effectiveness, call center statistics, and more business KPIs in the company. Dashboards provides managers, marketers, and analysts to quickly sort out the position of the company and to determine the weakest links. The dashboard helps to to compare easily different stages of business process and to accomplish the right decision. Business Intelligence Solution for ConceptDraw PRO makes for a powerful analytical tool that displays an organization’s processes and provides valuable competitive insight into business performance.This multipage business dashboard example shows navigation vertical menu and graphic indicators of logistic key performance indicators (KPIs) and business metrics.
"A performance indicator or key performance indicator (KPI) is a type of performance measurement. KPIs evaluate the success of an organization or of a particular activity in which it engages. Often success is simply the repeated, periodic achievement of some levels of operational goal..., and sometimes success is defined in terms of making progress toward strategic goals. Accordingly, choosing the right KPIs relies upon a good understanding of what is important to the organization." [Performance indicator. Wikipedia]
The performance dashboard example "Logistics KPI Dashboard" was designed using ConceptDraw PRO software extended with Logistic Dashboard solution from Business Processes area of ConceptDraw Solution Park.
This multipage business dashboard template contains navigation vertical menu and graphic indicators of logistic key performance indicators (KPIs) and business metrics.
Use it to create your logistic KPI dashboard with ConceptDraw PRO software.
The performance dashboard template "Logistics KPI Dashboard" is included in Logistic Dashboard solution from Business Processes area of ConceptDraw Solution Park.
Use it to create your logistic KPI dashboard with ConceptDraw PRO software.
The performance dashboard template "Logistics KPI Dashboard" is included in Logistic Dashboard solution from Business Processes area of ConceptDraw Solution Park.
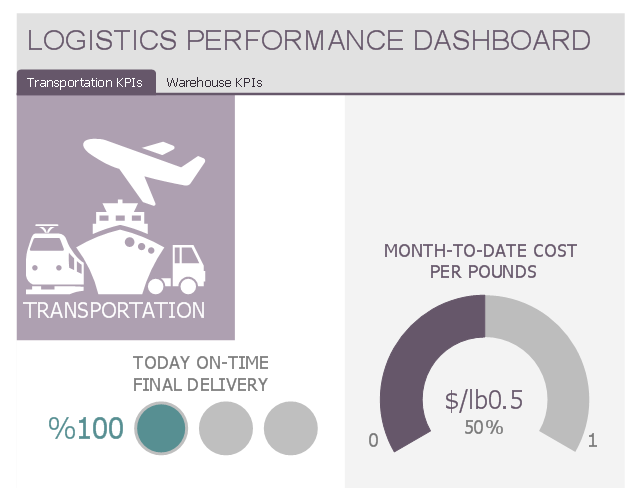
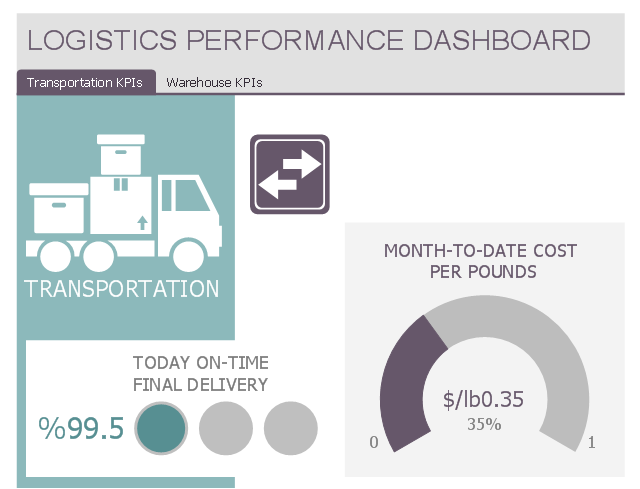
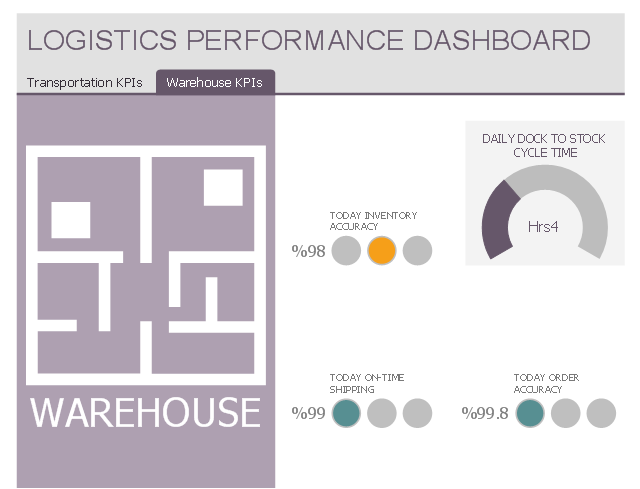
This multipage performance dashboard template contains navigation tab set and graphic indicators of logistic key performance indicators (KPIs) and business metrics.
Use it to create your logistic performance dashboard with ConceptDraw PRO software.
The business dashboard template "Logistics Performance Dashboard" is included in Logistic Dashboard solution from Business Processes area of ConceptDraw Solution Park.
Use it to create your logistic performance dashboard with ConceptDraw PRO software.
The business dashboard template "Logistics Performance Dashboard" is included in Logistic Dashboard solution from Business Processes area of ConceptDraw Solution Park.
This multipage performance dashboard example shows navigation tab set and graphic indicators of logistic key performance indicators (KPIs) and business metrics.
"Dashboards often provide at-a-glance views of KPIs (key performance indicators) relevant to a particular objective or business process (e.g. sales, marketing, human resources, or production)." [Dashboard (business). Wikipedia]
The business dashboard example "Logistics Performance Dashboard" was designed using ConceptDraw PRO software extended with Logistic Dashboard solution from Business Processes area of ConceptDraw Solution Park.
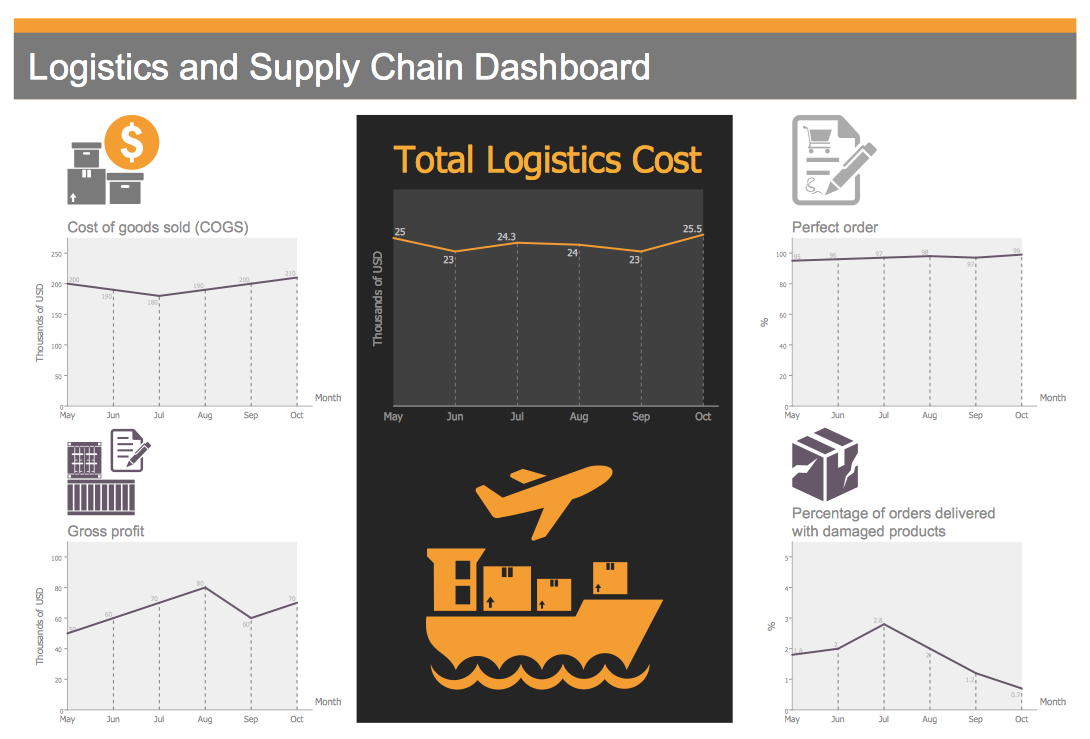
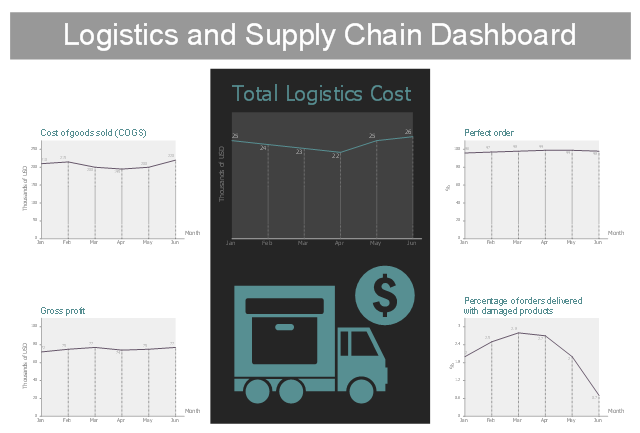
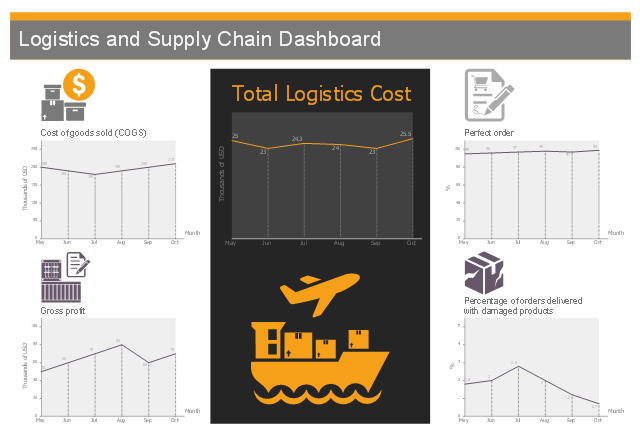
This business dashboard template contains 5 line charts of logistics and supply chain business metrics.
Use it to create your logistic and supply chain dashboard with ConceptDraw PRO software.
The performance dashboard template "Logistics and Supply Chain Dashboard" is included in Logistic Dashboard solution from Business Processes area of ConceptDraw Solution Park.
Use it to create your logistic and supply chain dashboard with ConceptDraw PRO software.
The performance dashboard template "Logistics and Supply Chain Dashboard" is included in Logistic Dashboard solution from Business Processes area of ConceptDraw Solution Park.
This business dashboard example shows 5 line charts of logistics and supply chain business metrics.
"A supply chain is a system of organizations, people, activities, information, and resources involved in moving a product or service from supplier to customer. Supply chain activities involve the transformation of natural resources, raw materials, and components into a finished product that is delivered to the end customer." [Supply chain. Wikipedia]
The performance dashboard example "Logistics and Supply Chain Dashboard" was designed using ConceptDraw PRO software extended with Logistic Dashboard solution from Business Processes area of ConceptDraw Solution Park.
 Spatial Dashboard
Spatial dashboard solution extends ConceptDraw PRO software with templates, samples and vector stencils libraries with thematic maps for drawing visual dashboards showing spatial data.
 Composition Dashboard
Composition dashboard solution extends ConceptDraw PRO software with templates, samples and vector stencils library with charts and indicators for drawing visual dashboards showing data composition.
 Meter Dashboard
Meter dashboard solution extends ConceptDraw PRO software with templates, samples and vector stencils library with meter indicators for drawing visual dashboards showing quantitative data.
 Status Dashboard
Status dashboard solution extends ConceptDraw PRO software with templates, samples and vector stencils libraries with graphic indicators for drawing the visual dashboards showing status data.
 Sales Dashboard
Sales Dashboard solution extends ConceptDraw PRO software with templates, samples and library of vector stencils for drawing the visual dashboards of sale metrics and key performance indicators (KPI).
- New Logistic Dashboard Addition to ConceptDraw Solution Park
- Logistics Performance Dashboard | Logistics Performance ...
- Download Kpi Transportation Logistics Dashboard Xls
- ConceptDraw | Press Releases
- Constant improvement of key performance indicators | Logistics KPI ...
- Frequency Distribution Dashboard | Logistics Flow Charts | Audit ...
- Logistics Flow Charts | Frequency Distribution Dashboard | Cisco ...
- Dashboard | Sales Dashboard | Logistic Dashboard | Free ...
- A KPI Dashboard Provides the Answers Your Sales Team | KPI ...
- Customer Relationship Management | Dashboard | Logistic ...
- Logistics Flow Charts | Logistic Dashboard | How to Make a ...
- Performance Indicators | Constant improvement of key performance ...
- Logistics and Supply Chain Dashboard
- Logistics and Supply Chain Dashboard - Template
- Logistic Dashboard | Fault Tree Analysis Diagrams | ConceptDraw ...
- Logistics Flow Charts | Logistics - Choreography BPMN 2.0 diagram ...
- Process Flowchart | Logistics
- Logistics Flow Charts | Process Flowchart | Logistic Dashboard ...
- Logistics Flow Charts | Frequency Distribution Dashboard ...
- Process Flowchart | Logistics Flow Charts | Logistic Dashboard ...
