Process Flowchart


Business Process Modeling

Bar Diagrams for Problem Solving. Create event management bar charts with Bar Graphs Solution

"A value chain is a chain of activities that a firm operating in a specific industry performs in order to deliver a valuable product or service for the market. ...
The concept of value chains as decision support tools, was added onto the competitive strategies paradigm developed by Porter as early as 1979. In Porter's value chains, Inbound Logistics, Operations, Outbound Logistics, Marketing and Sales and Service are categorized as primary activities. Secondary activities include Procurement, Human Resource management, Technological Development and Infrastructure." [Value chain. Wikipedia]
This Porter's value chain matrix diagram example was created using the ConceptDraw PRO diagramming and vector drawing software extended with the Matrices solution from the Marketing area of ConceptDraw Solution Park.
Porter's value chain matrix

 Business Process Diagrams
Business Process Diagrams solution extends the ConceptDraw PRO BPM software with RapidDraw interface, templates, samples and numerous libraries based on the BPMN 1.2 and BPMN 2.0 standards, which give you the possibility to visualize equally easy simple and complex processes, to design business models, to quickly develop and document in details any business processes on the stages of project’s planning and implementation.
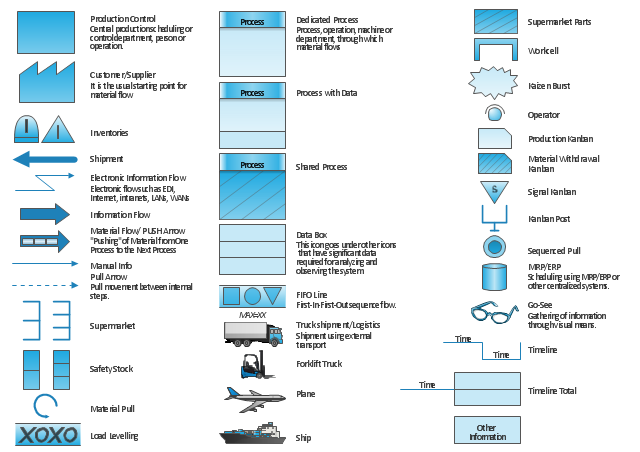
"Value stream mapping usually employs standard symbols to represent items and processes, therefore knowledge of these symbols is essential to correctly interpret the production system problems." [Value stream mapping. Wikipedia]
The vector stencils library Value stream mapping contains 43 symbols for drawing the value stream mapping diagrams using the ConceptDraw PRO diagramming and vector drawing software.
The example "Design elements - Value stream mapping diagram" is included in the Value Stream Mapping solution from the Quality area of ConceptDraw Solution Park.
VSM symbols
"Value Stream Map (VSM)
1. A tool used to improve a process by identifying added value and eliminating waste.
2. A process map that follows the value creation process.
A. “strap yourself to the product (or service) and see where you go”
3. A process map with data added.
A. Times: processing, wait, cycle.
B. Quality: number of rejects.
C. Inventory.
D. Resources.
1) Number of people.
2) Space.
3) Distance traveled.
E. Whatever else is useful for analyzing the process." [ocw.mit.edu/ courses/ aeronautics-and-astronautics/ 16-660j-introduction-to-lean-six-sigma-methods-january-iap-2012/ lecture-notes/ MIT16_ 660JIAP12_ 1-6.pdf]
This sample VSM flowchart shows the value stream in a manufacturing, production control and shipping processes.
This value stream mapping diagram example was created using the ConceptDraw PRO diagramming and vector drawing software extended with the Value Stream Mapping solution from the Quality area of ConceptDraw Solution Park.
Value stream mapping

Chen ERD Diagram

Business Process Modeling Tools

Business Models

Business Process Modeling Notation

Flow chart Example. Warehouse Flowchart


How To Plan and Implement Projects Faster

- Process Flowchart | Logistics - Choreography BPMN 2.0 diagram ...
- Logistics - Choreography BPMN 2.0 diagram | Logistics ...
- Logistics - Choreography BPMN 2.0 diagram | Process Flowchart ...
- Process Flowchart | Logistics - Choreography BPMN 2.0 diagram ...
- Logistics - Choreography BPMN 2.0 diagram | Design elements ...
- Logistics - Choreography BPMN 2.0 diagram | Business Process ...
- Logistics - Choreography BPMN 2.0 diagram | Process Flowchart ...
- Warehouse Process Flow Diagram Example
- Logistics - Choreography BPMN 2.0 diagram | ConceptDraw PRO ...
- Design elements - Choreographies BPMN 2.0 | Logistics ...
- Logistics - Choreography BPMN 2.0 diagram | Business Process ...
- BPMN 2.0 | Logistics - Choreography BPMN 2.0 diagram | Cab ...
- Logistics - Choreography BPMN 2.0 diagram
- BPMN 2.0 | Trouble ticket system - BPMN 2.0 diagram | Logistics ...
- Logistics Flow Chart Of Process
- Operational Diagram For Logistics
- Process Flowchart | Bar Diagrams for Problem Solving. Create event ...
- Logistics - Choreography BPMN 2.0 diagram | Logistics ...
- Logistics Workflow Diagram
- Logistics Workflow