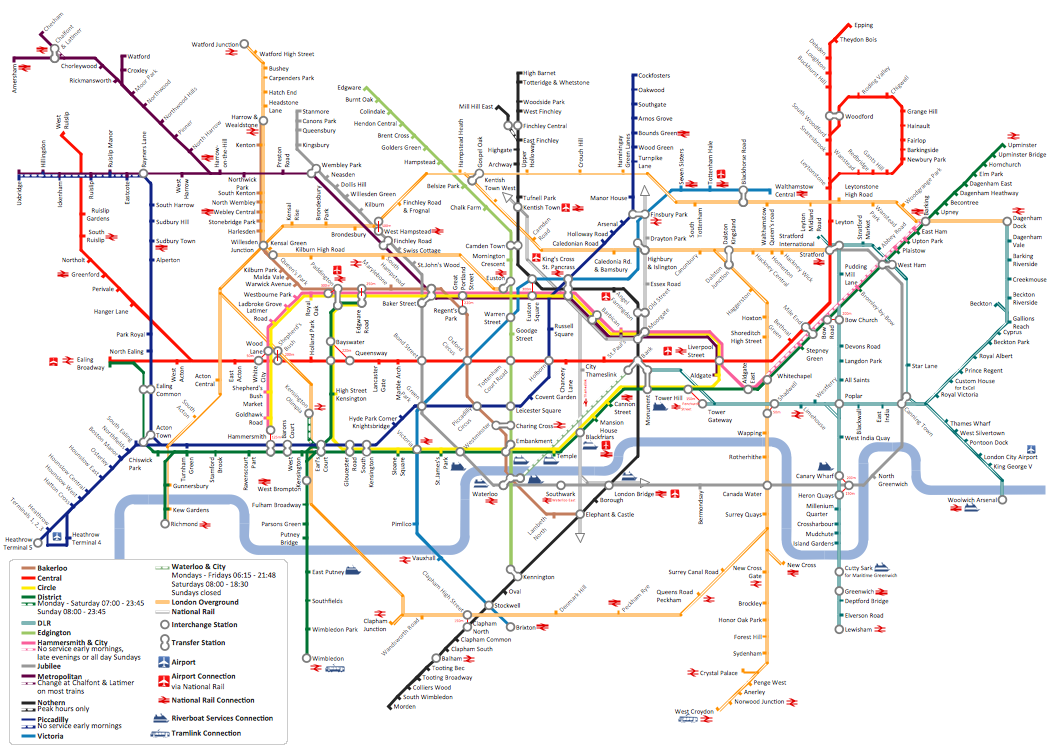
How to draw Metro Map style infographics? (London)
Tool to draw Metro Map styled inforgraphics. London Tube map sample.How to draw Metro Map style infographics? Moscow, New York, Los Angeles, London
The solution handles designs of any complexity, and the comprehensive library covers all key aspects of a transportation system. To further enhance your map design, there is the option to embed links, that can display station images or other relevant, important information. We have also included a set of samples in the solution, that show the possible real-world application — complex tube systems including the London Tube and New York City Subway show the level of detail possible when using the Metro Map Solution.
 Metro Map
Metro Map solution extends ConceptDraw DIAGRAM software with templates, samples and library of vector stencils for drawing the metro maps, route maps, bus and other transport schemes, or design tube-style infographics.
 Spatial Infographics
Spatial infographics solution extends ConceptDraw DIAGRAM software with infographic samples, map templates and vector stencils libraries with design elements for drawing spatial information graphics.
Business Diagram Software
When managing the projects, people, or networks, there are daily designed and used different types of Business diagrams, so the powerful drawing software will be very useful for this. ConceptDraw DIAGRAM with large quantity of business solutions will meet your needs and will help you convey your ideas successful and rapidly, no matter are you professional or beginner. It is the best choice for business specialists and technical professionals who need quickly and easily explore, visualize, and communicate information. ConceptDraw DIAGRAM business diagram software is the most powerful business software and relational charting software. Create advanced, completely customizable Business Process Diagrams, Business Flow Charts, Work Flow Diagrams, Organizational Charts, Audit diagrams, Marketing diagrams, Value Stream Maps, TQM diagrams, ERD diagrams, EPC diagrams, Cause and Effect diagrams, Infographics, Dashboards, and other Relational business diagrams from your data using the powerful drawing tools of ConceptDraw Solution Park.
- How to draw Metro Map style infographics? ( London ) | Infographic ...
- How to draw Metro Map style infographics? Moscow, New York, Los ...
- How to draw Metro Map style infographics? ( London ) | How to draw ...
- Maps | How to draw Metro Map style infographics? ( London ) | How ...
- Value Stream Mapping | How to draw Metro Map style infographics ...
- How to draw Metro Map style infographics? ( London ) | Value Stream ...
- How to draw Metro Map style infographics? ( London ) | How to draw ...
- How to draw Metro Map style infographics? ( London )
- How to draw Metro Map style infographics? ( London ) | How to draw ...
- How to draw Metro Map style infographics? ( London ) | London tube ...
- How to draw Metro Map style infographics? ( London ) | Metro Map ...
- How to draw Metro Map style infographics? ( London ) | London tube ...
- How to draw Metro Map style infographics? ( London ) | How to draw ...
- Metro Map | How to draw Metro Map style infographics? ( London ...
- How to draw Metro Map style infographics? ( London )
- How to draw Metro Map style infographics? Moscow, New York, Los ...
- How to draw Metro Map style infographics? Moscow, New York, Los ...
- How to draw Metro Map style infographics? (New York) | How to ...
- How to draw Metro Map style infographics? Moscow, New York, Los ...
- What is Infographics Area | How to draw Metro Map style ...


