HelpDesk
How to Create Management Infographics Using ConceptDraw PRO
Management might want to communicate a basic workflow for each division of the company, visualise business strategy and decision processes, or display a certain business training concept. In this case, an infographic can be more text heavy, and use illustrations to establish a timeline, process, or step-by-step sequence of events. ConceptDraw PRO can be used as a tool for creating management infographics. It allows you to draw infographics quickly and easily using the special templates and vector stencils libraries. Infographics can be used to quickly communicate a message, to simplify the presentation of large amounts of data, to see data patterns and relationships, and to monitor changes in variables over time. It can contain bar graphs, pie charts, histograms, line charts, e.t.c.HelpDesk
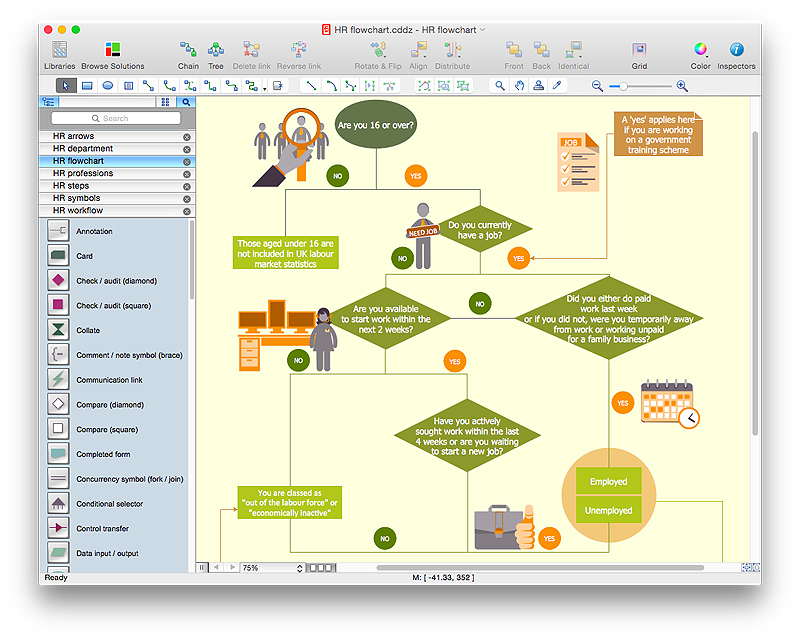
How to Create a HR Process Flowchart Using ConceptDraw PRO
One of the useful tools of each HR specialist is a HR Process Flowchart. HR Flowchart renders step-by-step the process of Human Resource management in any organization. HR flowchart shows the flow of all HR processes, identifies and standardizes the list of mandatory documents required for the implementation of all HR procedures, including the recruiting process. Usually, the descriptions of entire HR processes in a company requires a big set of graphic documents. They must be regularly redrawn to maintain up to date. The best tool for this is ConceptDraw PRO - the best software to create process flow diagrams of various types. In conjunction with ConceptDraw HR flowchart solution, it delivers comprehensive tool-set for human resource management.HelpDesk
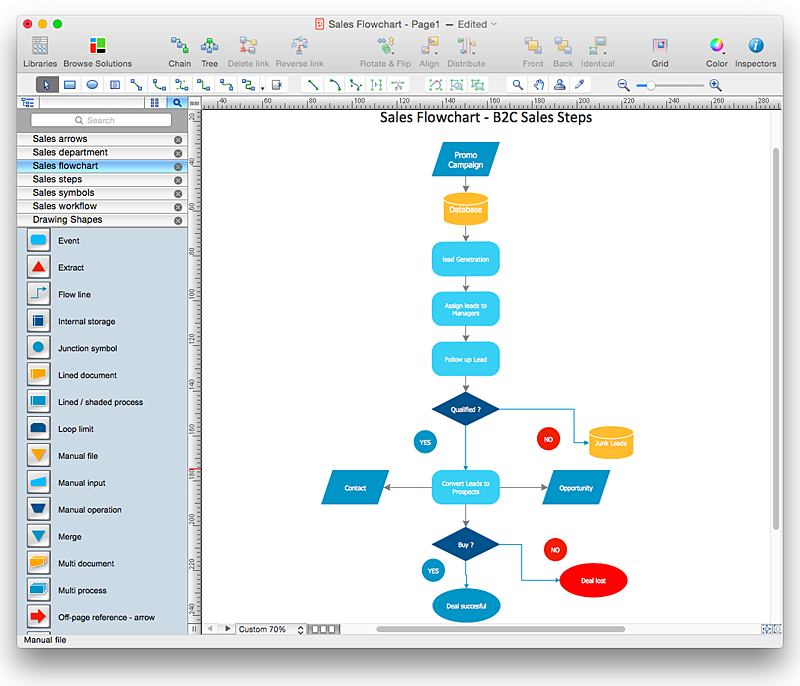
How to Create a Sales Flowchart Using ConceptDraw PRO
A Sales flowchart is a specialized type of flowchart. With the help of a sales flowchart you can visually describe tasks, documents, people responsible for execution at each stage of the sales process. For most commercial organizations, the sales process is inherent to its existence and ability to create profit. Although each company will achieve this aim in its own way, the core selling process remains similar throughout — a potential buyer or prospective customer exchanges money with an organization in return for goods or services. Despite this rather simplistic definition, there exists huge scope as to which approach is taken. Indeed, it is not uncommon for the sales division to be the largest within a corporate structure, employing a team of salespeople, analysts, and the sales managers, who are in charge of sales division operations.The practical applications of sales process flowcharts are numerous and wide ranging. At sales level, you might map the process of customer interactHelpDesk
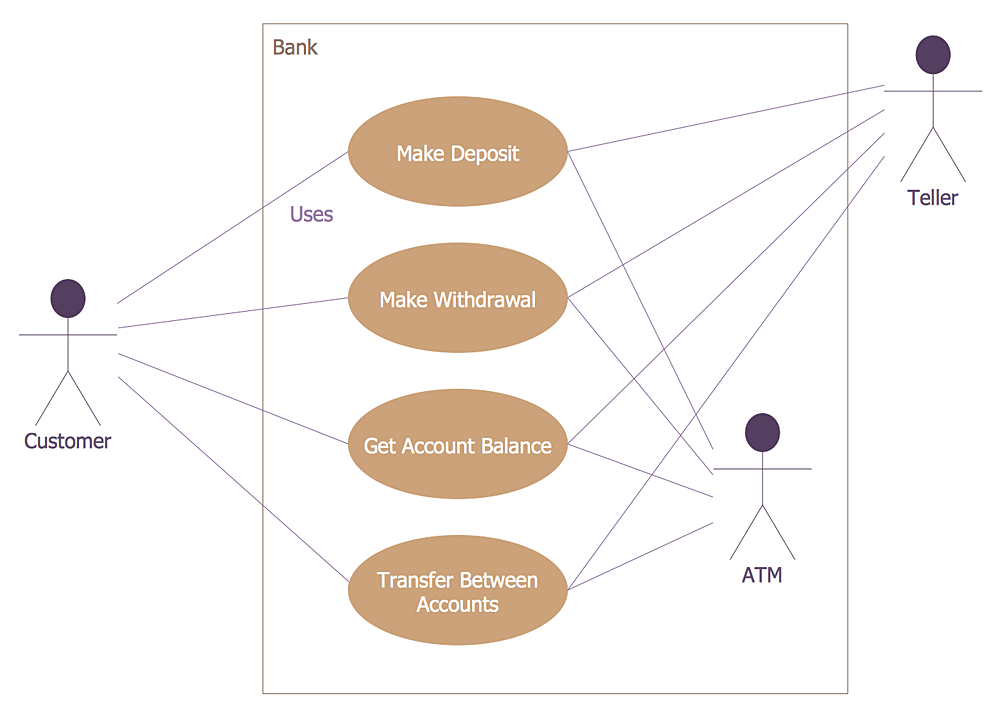
How to Create a Bank ATM Use Case Diagram
UML diagrams are often used in banking management for documenting a banking system. In particular, the interaction of bank customers with an automated teller machine (ATM) can be represented in a Use Case diagram. Before the software code for an ATM, or any other system design, is written, it is necessary to create a visual representation of any object-oriented processes. This is done most effectively by creating a Unified Modeling Language (UML) diagram, using object-oriented modeling. UML works as a general purpose modeling language for software engineers or system analysts, offering a number of different diagram styles with which to visually depict all aspects of a software system. ConceptDraw PRO diagramming software, enhanced and expanded with the ATM UML Diagrams solution, offers the full range of icons, templates and design elements needed to faithfully represent ATM and banking information system architecture using UML standards. The ATM UML Diagrams solution is useful for beginner and advanced users alike. More experienced users will appreciate a full range of vector stencil libraries and ConceptDraw PRO's powerful software, that allows you to create your ATM UML diagram in a matter of moments.
 Wireless Networks
The Wireless Networks Solution extends ConceptDraw PRO software with professional diagramming tools, set of wireless network diagram templates and samples, comprehensive library of wireless communications and WLAN objects to help network engineers and designers efficiently design and create Wireless network diagrams that illustrate wireless networks of any speed and complexity, and help to identify all required equipment for construction and updating wireless networks, and calculating their costs.
 Business Processes Area
Solutions of Business Processes area extend ConceptDraw PRO software with samples, templates and vector stencils libraries for drawing business process diagrams and flowcharts for business process management.
- How to Draw an Organization Chart | Pie Chart Examples and ...
- Examples of Flowcharts, Org Charts and More | Business Diagram ...
- ConceptDraw PRO - Organizational chart software | Organizational ...
- Organizational Structure | ConceptDraw PRO - Organizational chart ...
- Gant Chart in Project Management | Army Flow Charts | How to ...
- Pyramid Chart Examples | Pyramid Diagram | Organizational Charts ...
- Marketing | Flowchart Example: Flow Chart of Marketing Analysis ...
- Marketing and Sales Organization chart . Organization chart Example
- Marketing and Sales Organization chart . Organization chart ...
- Organizational culture - Triangle diagram | Pyramid Chart Examples ...
- Creative Organizational Charts
- Flow process chart | Flow process chart template | Pyramid Diagram
- Pyramid Diagram | How To Plan and Implement Projects Faster ...
- Business Diagram Software | Pyramid Diagram | Business diagrams ...
- Quality function deployment chart - Handheld projector | Pyramid ...
- Business Diagram Software | Business diagrams & Org Charts with ...
- Pyramid Diagram | Organizational Charts | 25 Typical Orgcharts ...
- Software Work Flow Process in Project Management with Diagram ...
- Pyramid Diagram and Pyramid Chart | Pyramid Chart Maker ...


