Process Flowchart
The main reason of using Process Flowchart or PFD is to show relations between major parts of the system. Process Flowcharts are used in process engineering and chemical industry where there is a requirement of depicting relationships between major components only and not include minor parts. Process Flowcharts for single unit or multiple units differ in their structure and implementation. ConceptDraw PRO is Professional business process mapping software for making Process flowcharts, Process flow diagram, Workflow diagram, flowcharts and technical illustrations for business documents and also comprehensive visio for mac application. Easier define and document basic work and data flows, financial, production and quality management processes to increase efficiency of your business with ConcepDraw PRO. Business process mapping software with Flowchart Maker ConceptDraw PRO includes extensive drawing tools, rich examples and templates, process flowchart symbols and shape libraries, smart connectors that allow you create the flowcharts of complex processes, process flow diagrams, procedures and information exchange. Process Flowchart Solution is project management workflow tools which is part ConceptDraw Project marketing project management software. Drawing charts, diagrams, and network layouts has long been the monopoly of Microsoft Visio, making Mac users to struggle when needing such visio alternative like visio for mac, it requires only to view features, make a minor edit to, or print a diagram or chart. Thankfully to MS Visio alternative like ConceptDraw PRO software, this is cross-platform charting and business process management tool, now visio alternative for making sort of visio diagram is not a problem anymore however many people still name it business process visio tools.
 Event-driven Process Chain Diagrams
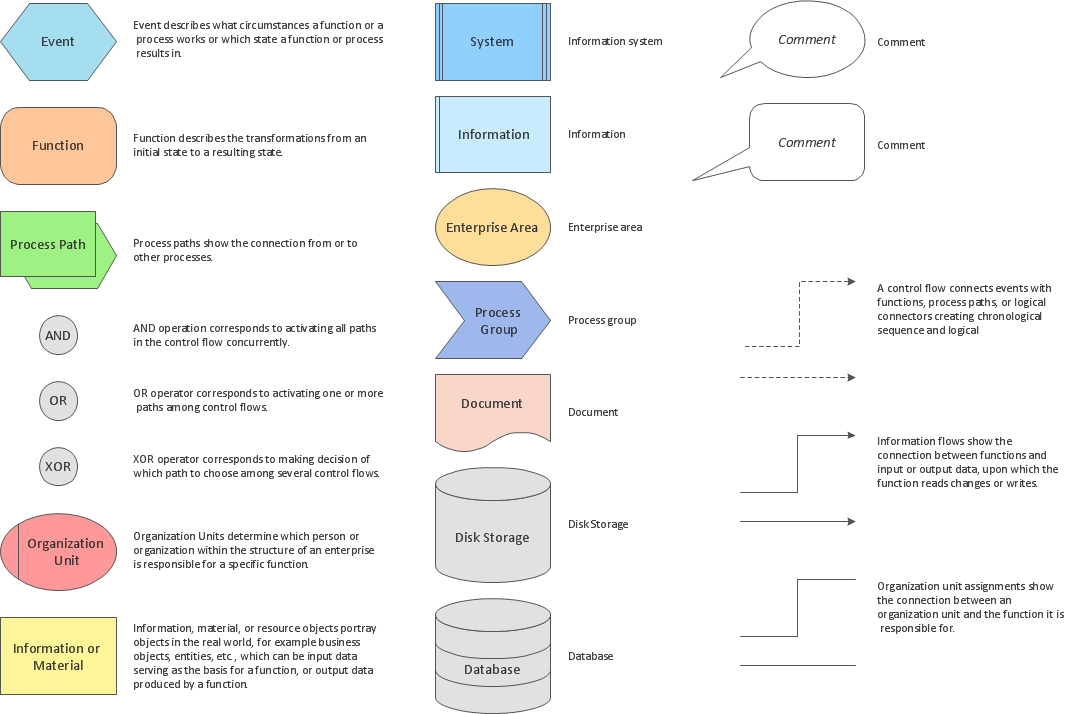
Event-driven Process Chain (EPC) Diagram is a type of flowchart widely used for modeling in business engineering and reengineering, business process improvement, and analysis. EPC method was developed within the Architecture of Integrated Information Systems (ARIS) framework.
Stakeholder Management System
Stakeholder management is a critical component to the successful delivery of any project, programme or activity. ConceptDraw PRO is a powerful diagramming and vector drawing software. Now, thanks to the Stakeholder Onion Diagrams Solution included to the Management Area of ConceptDraw Solution Park, ConceptDraw PRO became also unique stakeholder management system design software.Flow Chart Symbols
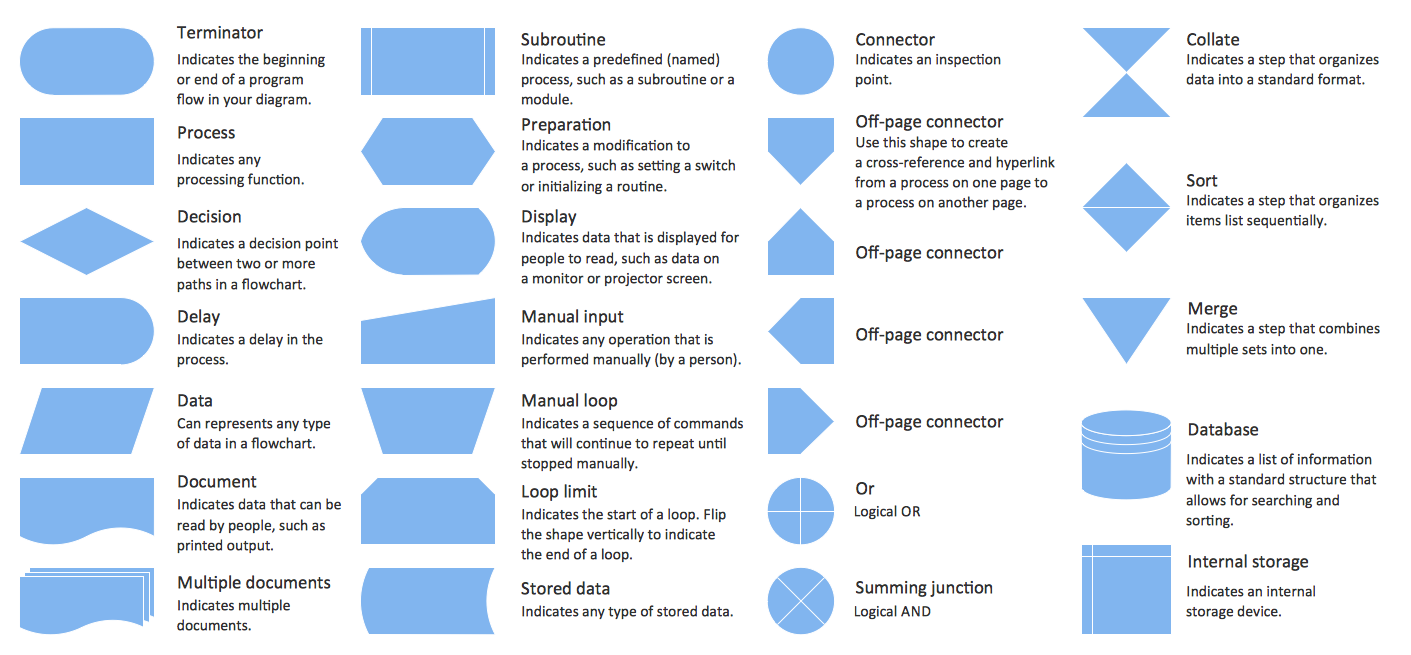
The Flowcharts are incredibly useful and popular tool used in science, business, software development, analytics, engineering, marketing, manufacturing, administration, architecture, government, politics, and many other fields thanks to a variety of existing types of flowcharts. A Flowchart is a visual graphical representation of the process, algorithm, or the set of steps taken for problem's solution. Widely used for designing, visualizing and documenting simple and complex processes and programs, they effectively help to understand the process and to find easier the flaws if they are. Each flowchart type supposes the use of its own set of notations for drawing corresponding diagram, which includes the symbols of process, decision, data, document, data base, termination, initiation processes, processing loops, conditions, etc. It is easily design a Flowchart using the special professional flowchart maker - ConceptDraw PRO diagram software with numerous predesigned flow chart symbols grouped in libraries of Flowcharts solution from ConceptDraw Solution Park.
 Audit Flowcharts
Audit flowcharts solution extends ConceptDraw PRO software with templates, samples and library of vector stencils for drawing the audit and fiscal flow charts.
Software for Drawing EPC Diagrams
Event-Driven Process chain Diagrams for improvement throughout an organisation. ConceptDraw PRO - software that reduces the time needed to create a business process model.Orgchart
Workforce planning is strategically important for each company, organization, enterprise, and corporation, non important it is business, commercial, non-profit or government organization. Organizational Chart or Orgchart is a type of diagram that is successfully used to graphically illustrate the structure of an organization and also relationships between its parts. There are three different types of Orgcharts: hierarchical, matrix and flat. ConceptDraw PRO diagramming and vector drawing software supplied with Organizational Charts Solution from Management Area is the best for easy designing professional-looking Orgcharts. This solution provides you the predesigned samples and Organizational Chart library with ready-to-use vector objects required for Orgchart design. It also offers the most simple way of drawing - the possibility to start with one of built-in Orgchart templates. Typically Orgcharts require for regular updating and making modifications, in ConceptDraw PRO it is fast and easy, the blocks are editable and remain connected when they are moved.The Best Tool for Business Process Modeling
The EPC diagram shows various business processes in terms of work flows. Event-Driven Process chain Diagrams for improvement throughout an organisation. ConceptDraw PRO - business process mapping software that reduces the time needed to create a business process model and is excellent business process improvement tools.
 Biology
Biology solution extends ConceptDraw PRO software with samples, templates and libraries containing biological vector symbols, to help you create scientific and educational designs in the field of biology.
 Mathematics
Mathematics solution extends ConceptDraw PRO software with templates, samples and libraries of vector stencils for drawing the mathematical illustrations, diagrams and charts.
Conception d'organigramme Organigramme des symboles, formes, stencils et icônes
Mavericks a toujours voulu se démarquer, notamment grâce à des choix de design épurés. Les présentations et documents graphiques professionnels sont plus compréhensibles et clairs s'ils utilisent des thématiques de couleurs distinctes pour leurs différentes composantes. La présentation par organigramme rend les démonstrations et les explications de processus opérationnels plus flexibles, et offre un aperçu d'un nouveau genre, se démarquant des organigrammes noir et blanc classiques sur papier. Les meilleures présentations peuvent être obtenues en utilisant les modèles « Conceptdraw » adéquats comme base de départ. Choisissez simplement l'un d'eux et entrez le texte souhaité dans chaque forme du diagramme. Appliquez moins de couleurs dans le document afin de ne pas le transformer en arc-en-ciel, trois ou quatre sera suffiront, notez également que la modélisation des processus opérationnels ne doivent pas contenir des nuances trop claires. Il est aussi- Biomass Flow Diagram From Source To Final Utilisation
- Flow Diagram Source To Final Utilisation For Biomass And Fuel
- Include A Detailed Flow Diagram From Source To Final Utilisation ...
- Detailed Flow Diagram From Source To Final Utilisation Of Wave
- A Flow Diagram Of Biomass From Sourcr To Final Utilisation
- A Detailed Flow Diagram From Wave Energy As A Source To Final
- Wave Energy Flow Diagram From Source To Final Utilisation
- Flow Diagram Of Biomassfrom Source To Utilisation
- Include A Detailed Flow Diagram From The Wave Energy
- Flow chart Example. Warehouse Flowchart | Chart Examples | Chart ...
- How To use House Electrical Plan Software | Include A Detailed ...
- How Does Biomass Work And Include A Detailed Flow Diagramfrom ...
- Wave Energy Detailed Flow Diagram
- Resources and energy - Vector stencils library | Energy resources ...
- Example of DFD for Online Store (Data Flow Diagram ) DFD ...
- Event-driven Process Chain (EPC) Diagram Software | Event-driven ...
- Example of DFD for Online Store (Data Flow Diagram ) DFD ...
- Workflow Diagram Software Mac | Examples of Flowchart | Critical ...
- Flow Chart Symbols | Swim Lane Flowchart Symbols | ERD Symbols ...
- How to Add a Workflow Diagram to a PowerPoint Presentation ...


