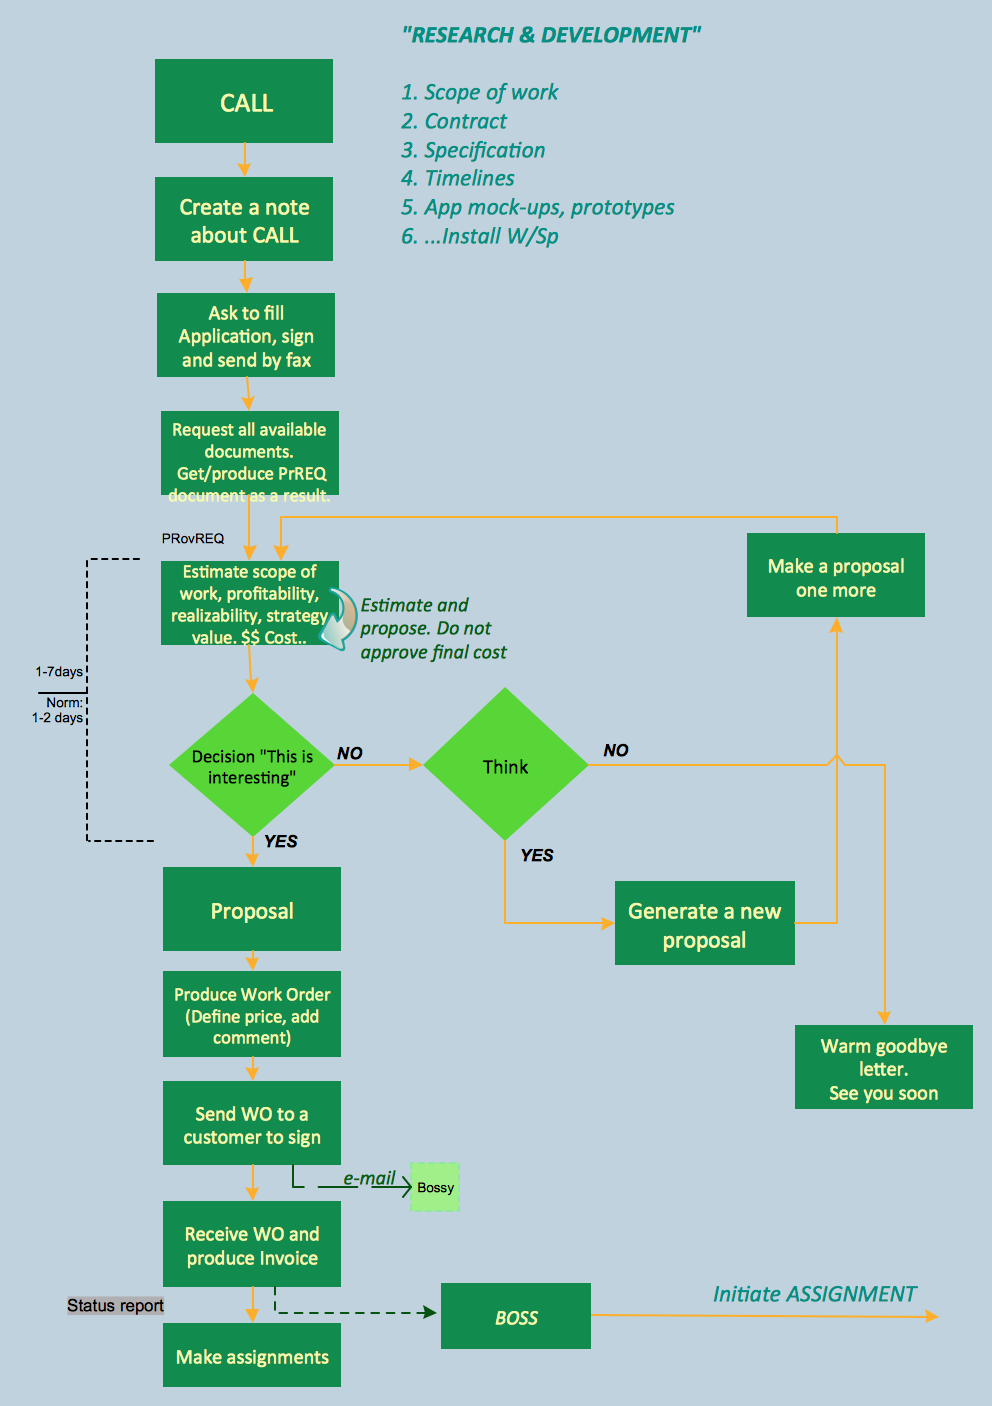
Create TQM Flowcharts for Mac
The Total Quality Management Diagram solution helps your organization visualize business and industrial processes. Create Total Quality Management diagrams for business process with ConceptDraw software.Workflow Diagram Software Mac
ConceptDraw DIAGRAM software is the best Mac software for drawing workflow diagrams. Its rich set of samples and templates, and specific features to draw diagrams faster make this software as comfortable as possible for drawing workflow diagrams. Use the ConceptDraw DIAGRAM professional Mac OS X software for drawing workflow diagram. The Workflow Diagrams solution with its libraries and templates set make the possibility to identify resources that are required for work goal implementation. The process flow diagram identify flow which occurs as network of process dependencies, organizational decisions and interactions between departments. Usually workflow diagrams show business participants actions that carry product or service to the final destination, the consumer.One formula of professional mind mapping : input data + output data + make great presentation
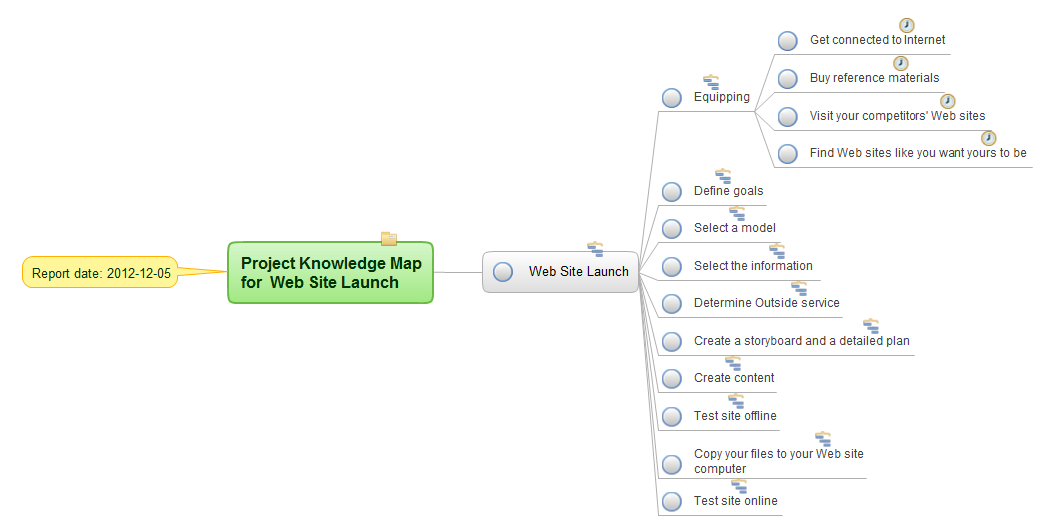
ConceptDraw MINDMAP is a powerful software from ConceptDraw Office suite, which provides a lot of tools and components for professional Mind Mapping. Besides the extensive tools for creation attractive and great-looking Mind Maps, it offers also wide import capabilities from MS Office files and mind mapping files MindJet MindManager, XMind and FreeMind, extensive export capabilities to common formats, such as PDF, HTML, different graphic formats, the possibility to generate MS Office documents, Project Management reports, PowerPoint presentations and demonstrate them via Skype conference call. Use of Skype conference call feature lets you to demonstrate the presentation's slide show and control it on computers of Skype call participants. This Report Mind Map example created in ConceptDraw MINDMAP software depicts the current project status and includes many pages and slides. This Project Status Report can be easy played as a slide show presentation on the large screen or to remote team using Skype conference call.UML Collaboration Diagram Example Illustration
UML Collaboration Diagram Example Illustration. This sample was created in ConceptDraw DIAGRAM diagramming and vector drawing software using the UML Collaboration Diagram library of the Rapid UML Solution from the Software Development area of ConceptDraw Solution Park. This sample shows the creation process of the contact list and can be used at the staff training and staff working, at the attraction process the new clients.Project Management
Mind Maps is a visual tool that helps to structure, understand and analyze the information, to find new ideas and solutions to problems. They find their application in many areas of life due to the fact that are convenient graphical way of presenting information. The project management is one of the most popular applications of Mind Maps, which give you the opportunity to make your project plan, to navigate easier in the project and manage it visually, to systematize knowledge, to get a clear picture of what is happening in the project, to save time and quickly find the right solutions and possible defects. Mind Maps ideally suit as a way to make notes during the meetings, presentations, conferences, to record ideas generated during a brainstorming. ConceptDraw MINDMAP software is effective for using in project management. It offers the tools for brainstorming and Mind Maps construction, helps project managers to visually represent the whole project, its implementation phases, to track the current state and switch between the different levels of detailing, showing or hiding some branches. ConcepDraw MINDMAP lets the possibility to make the report or presentation from your Mind Map and provides the compatibility with ConceptDraw Project and MS Project.Pyramid Diagram
Triangle diagram example of DIKW pyramid has 4 levels: data, information, knowledge and wisdom.Fishbone Problem Solving
The knowledge and ability to apply various strategies for dealing with problems and difficult situations is very useful in many areas. The Fishbone strategy is one of the most progressive. This graphical technique helps to identify possible causes of problems, to set the goals, and also show internal connections between the different parts of problem. After reviewing all causes and facts, you can easily find right solution. ConceptDraw DIAGRAM diagramming and vector drawing software extended with Fishbone Diagrams Solution from the Management Area of ConceptDraw Solution Park is a powerful Fishbone Problem Solving tool.Fishbone Problem Solving
The knowledge and ability to apply various strategies for dealing with problems and difficult situations is very useful in many areas. The Fishbone strategy is one of the most progressive. This graphical technique helps to identify possible causes of problems, to set the goals, and also show internal connections between the different parts of problem. After reviewing all causes and facts, you can easily find right solution. ConceptDraw DIAGRAM diagramming and vector drawing software extended with Fishbone Diagrams Solution from the Management Area of ConceptDraw Solution Park is a powerful Fishbone Problem Solving tool.Good Flow Chart app for Mac
The ConceptDraw DIAGRAM is a good flow chart app for Mac. Numerous vector stencils, samples and templates created by designers allows you to draw any type of flowchart.Project Management
Mind Maps is a visual tool that helps to structure, understand and analyze the information, to find new ideas and solutions to problems. They find their application in many areas of life due to the fact that are convenient graphical way of presenting information. The project management is one of the most popular applications of Mind Maps, which give you the opportunity to make your project plan, to navigate easier in the project and manage it visually, to systematize knowledge, to get a clear picture of what is happening in the project, to save time and quickly find the right solutions and possible defects. Mind Maps ideally suit as a way to make notes during the meetings, presentations, conferences, to record ideas generated during a brainstorming. ConceptDraw MINDMAP software is effective for using in project management. It offers the tools for brainstorming and Mind Maps construction, helps project managers to visually represent the whole project, its implementation phases, to track the current state and switch between the different levels of detailing, showing or hiding some branches. ConcepDraw MINDMAP lets the possibility to make the report or presentation from your Mind Map and provides the compatibility with ConceptDraw Project and MS Project.GUI Interface
What is the ideal GUI interface? The interface of mobile device it's all that users see on it and can interact - screen, bars, icons of applications. So the interface is the first that draws the user's attention. The main goal of software engineers, GUI interface designers, and GUI developers is to make the interface first of all easy for perception and understanding, convenient and attractive for the users. The iPhone's GUI interface meets all these requirements.Diagrama de Topologia
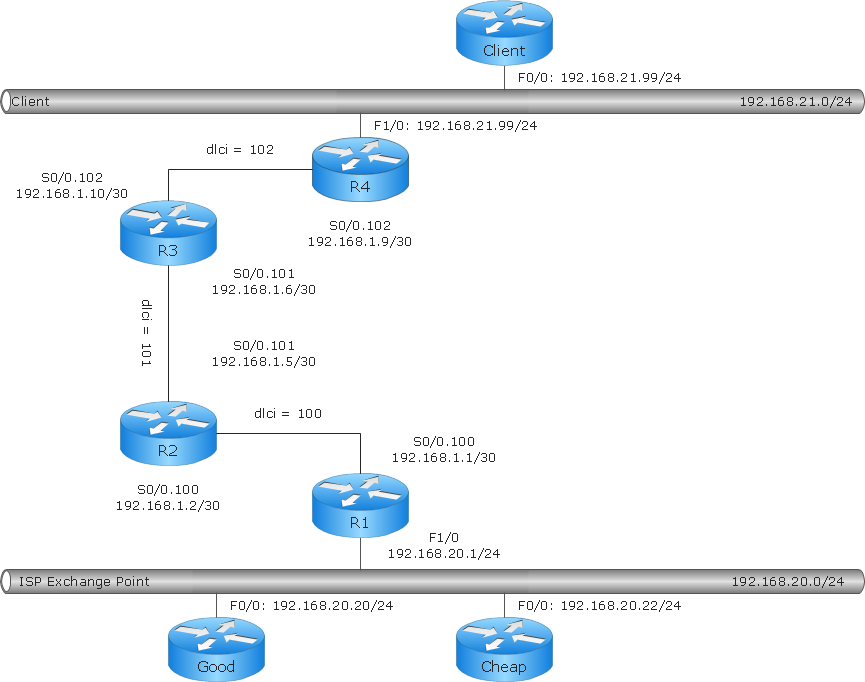
PRO is a powerful drawing tool that changes the way diagrams are produced. ConceptDraw Arrows10 Technology - This is more than enough versatility to draw any type of diagram with any degree of complexity. Diagrama de Topologia or Topology Diagram helps you see the big picture as you develop a service.Basic Diagramming Flowchart Software
ConceptDraw DIAGRAM is a powerful intelligent vector graphics tool for drawing flowcharts.Risk Diagram (Process Decision Program Chart)
The risk is a probable event in result of which may occur the negative events and adverse consequences. The risk management is a very important process in any field, it is a process of making the management decisions aimed on the reducing the likelihood of appearing the unfavorable results and on the minimizing potential losses, as well as the implementation of these solutions. The main purpose of applying the risk management is increasing of enterprise's competitiveness with help of protection against the risks. ConceptDraw MINDMAP software is perfect for identifying the risks, analyzing and managing risks, for designing Risk Diagrams, for developing effective actions in response to circumstances and potential obstacles that were identified as risks. It is also the best for designing Process Decision Program Charts and representing the PDPC method, which is effective way of detailed planning and depiction the whole sequence of actions on the path from the formulation a problem to its solution. The PDPC lets determine the risks when corrective actions are not performed correctly and helps develop descriptions for preventive actions.What Is a Concept Map
What is a Concept Map and what software is effective for its design? A concept map or conceptual diagram is a diagram that depicts suggested relationships between concepts. As for effective software - we suggest you to pay attention for the ConceptDraw DIAGRAM diagramming and vector drawing software. Extended with Concept Maps Solution from the "Diagrams" Area it is a real godsend for you.Design Element: Crows Foot for Entity Relationship Diagram - ERD
Entity-Relationship Diagram (ERD) is ideal tool that helps execute the detalization of data warehouse for a given designed system, lets to document the system's entities, attributes (objects' properties), and their interactions each other (relationships). Creation of an ERD requires the choice of specific set of notations, which the best suits for your database design. Two notations - Chen’s and Crow's Foot are applied for ERDs design. Chen's notation was developed first and has linguistic approach, the boxes represent the entities and are considered as nouns, relationships between them are shown as diamonds in a verb form. Over time Chen’s style was adapted into the popular standard - Crow’s Foot notation, where entities are shown as boxes and relationships - as labeled lines. ConceptDraw DIAGRAM software supplied with Entity-Relationship Diagram (ERD) solution offers samples and templates of ER diagrams, and also ready-to-use vector design elements - ERD Crow′s Foot and Chen's notation icons for easy designing your own ER diagrams for depicting databases.- Pyramid Diagram | Knowledge Management Software
- Bubble Diagrams | Workflow Diagrams | Block Diagrams | Business ...
- Pyramid Diagram | Knowledge Management Process Flow Diagram
- Network Layout Floor Plans | How to Create a SIPOC Diagram ...
- Management pictograms | Knowledge Management Icons
- Management pictograms | Knowledge Management Icon
- Project management life cycle | A Flowchart For Managing A Program
- | How To Create Project Report | Business Process Management ...
- Remote Projects in Corporate Strategy | ConceptDraw PROJECT ...