How to Make SWOT Analysis in a Word Document
A SWOT Analysis is a popular tool of the strategic planning which is used to evaluate the Strengths, Weaknesses, Opportunities, and Threats that are involved in any businesses. Use of mind maps allows you to collect a lot of information used for SWOT Analysis, visually structure it and also identify the relationships between different parts of this information. SWOT and TOWS Matrix Diagrams solution for ConceptDraw Solution Park combines professional visual advantages of ConceptDraw MINDMAP software and presentation capabilities of ConceptDraw DIAGRAM , which together provide a complete work solution. The SWOT and TOWS diagrams, matrices or mind maps produced in ConceptDraw DIAGRAM using the predesigned vector objects or filling the ready templates, can be then easily exported to Microsoft Word, Microsoft Visio, Microsoft PowerPoint, Adobe PDF, and many other electronic file formats. The possibility of export makes easy the use of SWOT diagrams designed in ConceptDraw DIAGRAM and lets you efficiently collaborate even with people who maybe don't have this software.How to Make a Timeline
Timeline is a type of diagram which illustrates the series of events in a chronological order on a linear timescale. How to make a timeline? It is convenient to use a modern powerful software. ConceptDraw DIAGRAM diagramming and vector drawing software extended with Timeline Diagrams solution from the Management area is exactly what you need.Make Your Own Floor Plans
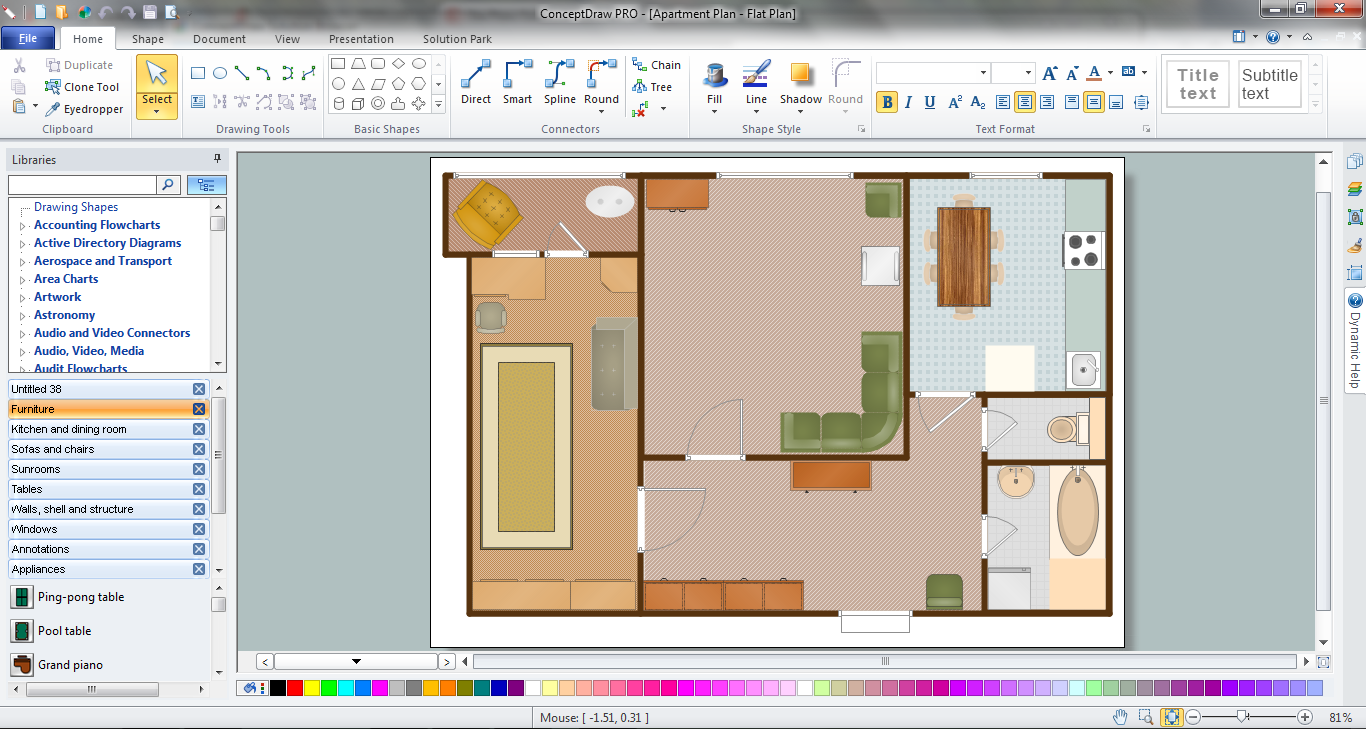
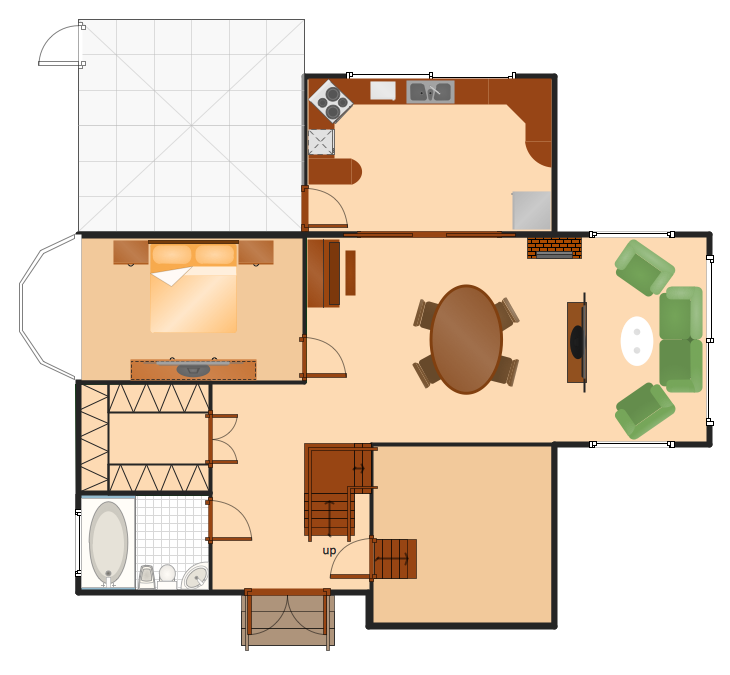
ConceptDraw DIAGRAM diagramming and vector drawing software offers the Floor Plans Solution from the Building Plans area of ConceptDraw Solution Park to make your own Floor Plans creating fast and simple.Make an Infographic
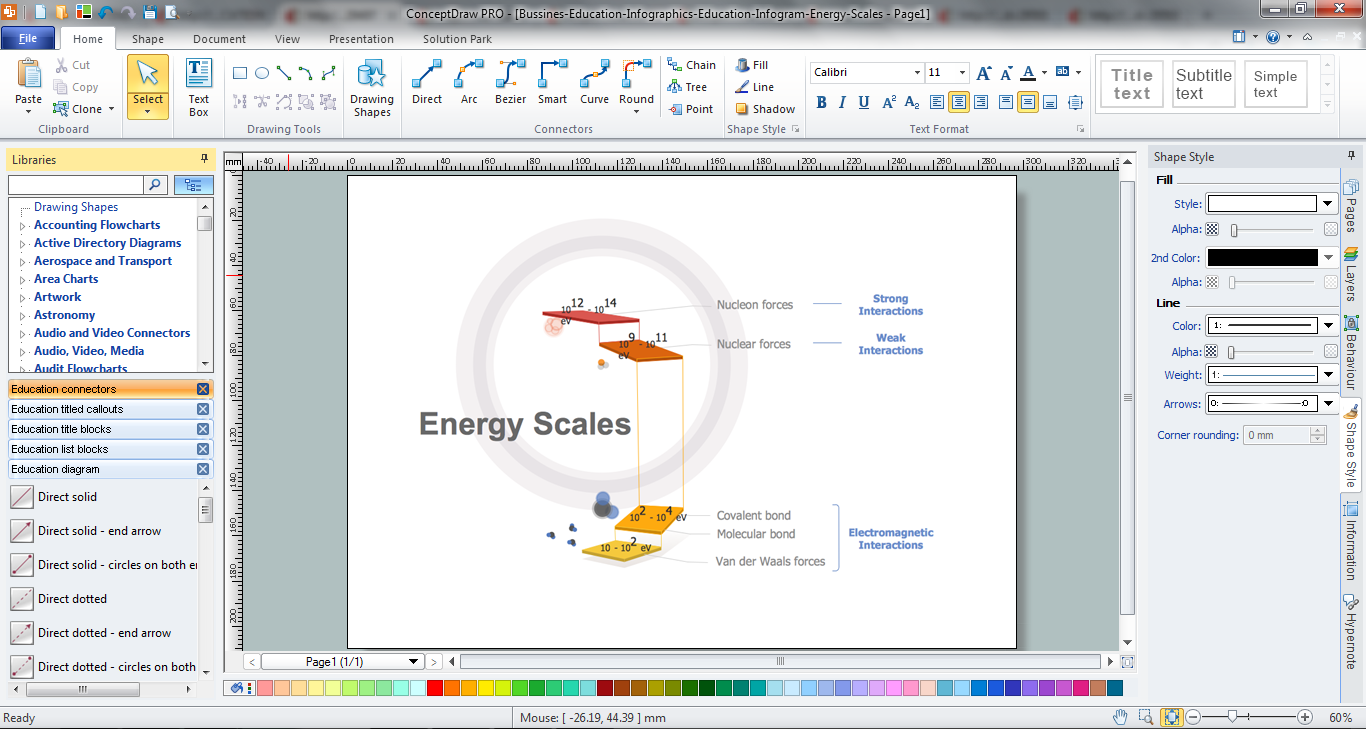
You want to make an infographic and need the useful and convenient drawing tools for this? In this case the ConceptDraw DIAGRAM software extended with Education Infographics Solution is a real godsend for you.How to Make an Infographic
How to Make an Infographic quick and easy? The perfect way is to use the ConceptDraw DIAGRAM diagramming and vector drawing software extended with Education Infographics Solution from the Business Infographics Area.How To Make a Concept Map
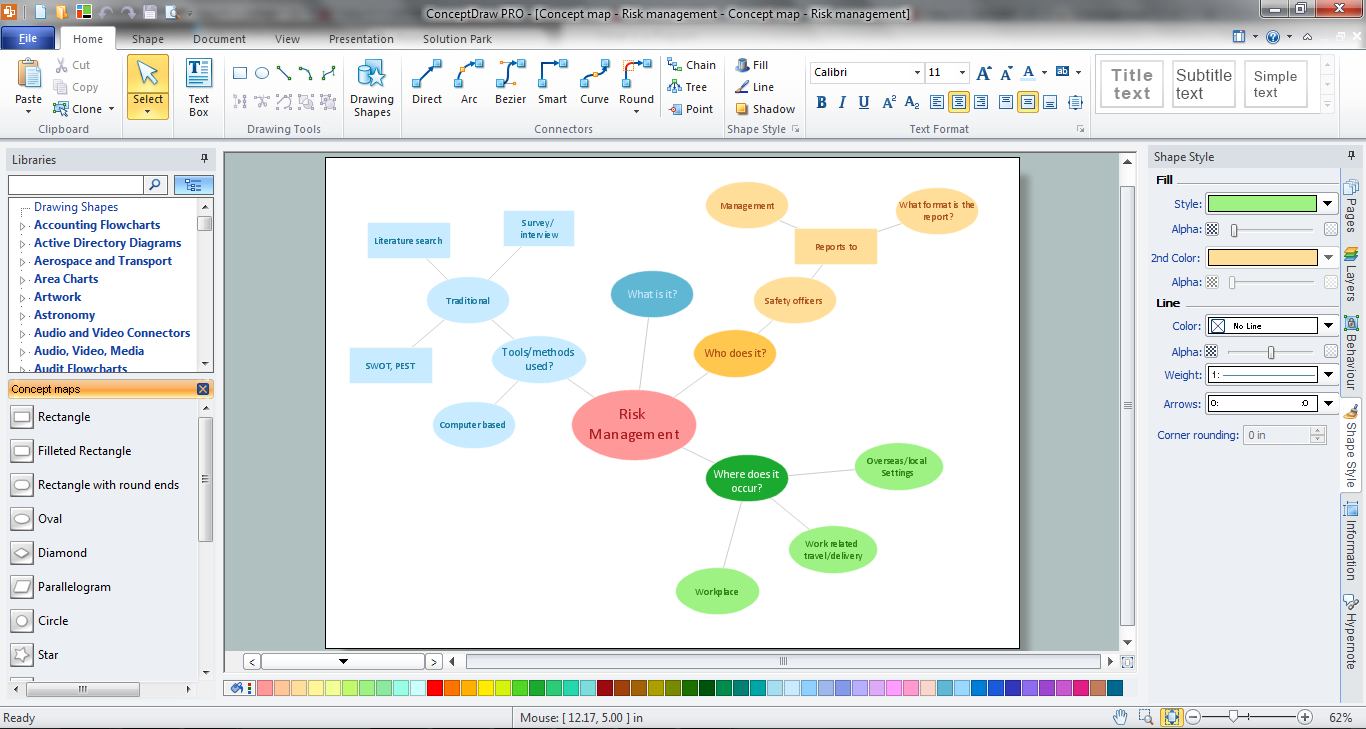
How to make a Concept Map fast and easy? ConceptDraw DIAGRAM diagramming and vector drawing software extended with Concept Maps Solution from the "Diagrams" Area is the best choice for those who want design professional looking Concept Map in minutes.Make a Scatter Plot
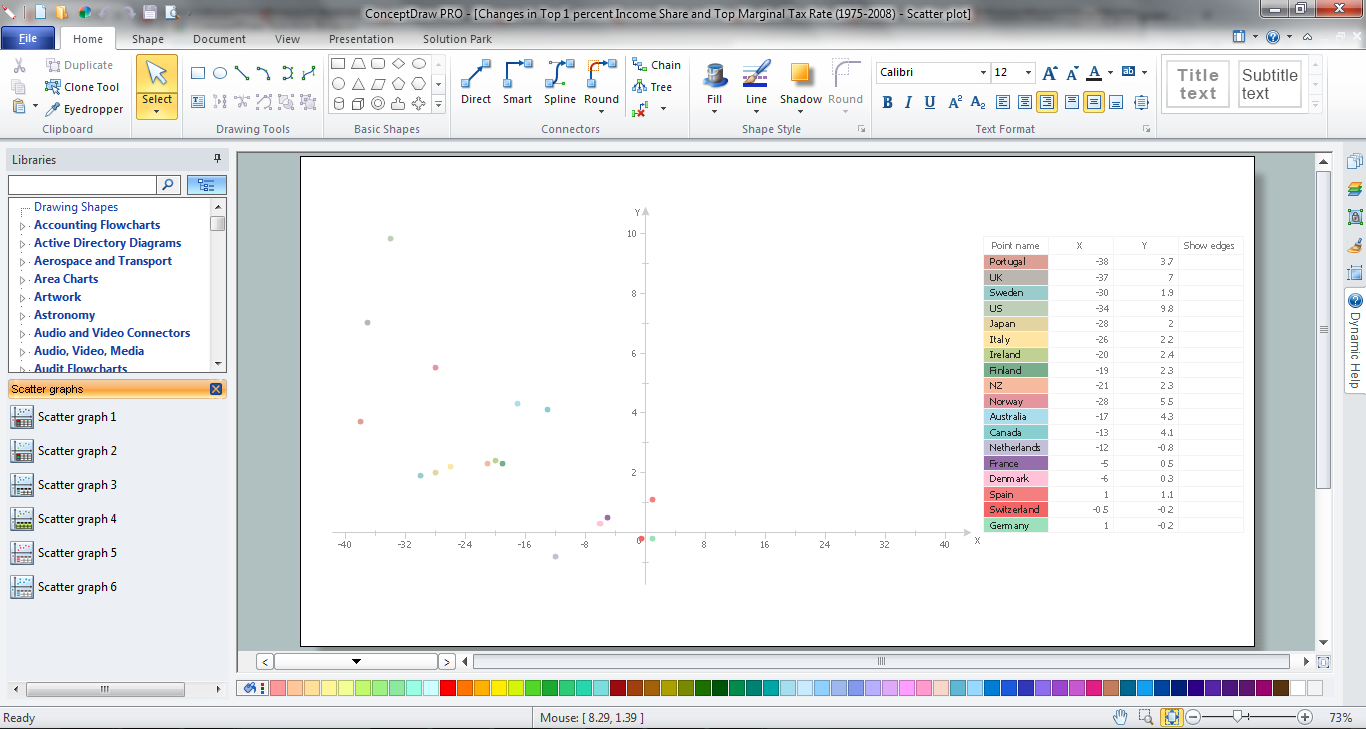
ConceptDraw DIAGRAM diagramming and vector drawing software offers the Scatter Diagrams Solution from the Graphs and Charts Area to make a Scatter Plot creating fast and simple.How To Make a Floor Plan
How To Make a Floor Plan? Usually drawing of Floor Plans is quite complex and time-taking process. But now thanks to the ConceptDraw DIAGRAM diagramming and vector drawing software extended with Floor Plans Solution from the Building Plans area of ConceptDraw Solution Park this process became quick and simple.How To Make Histogram in ConceptDraw DIAGRAM ?
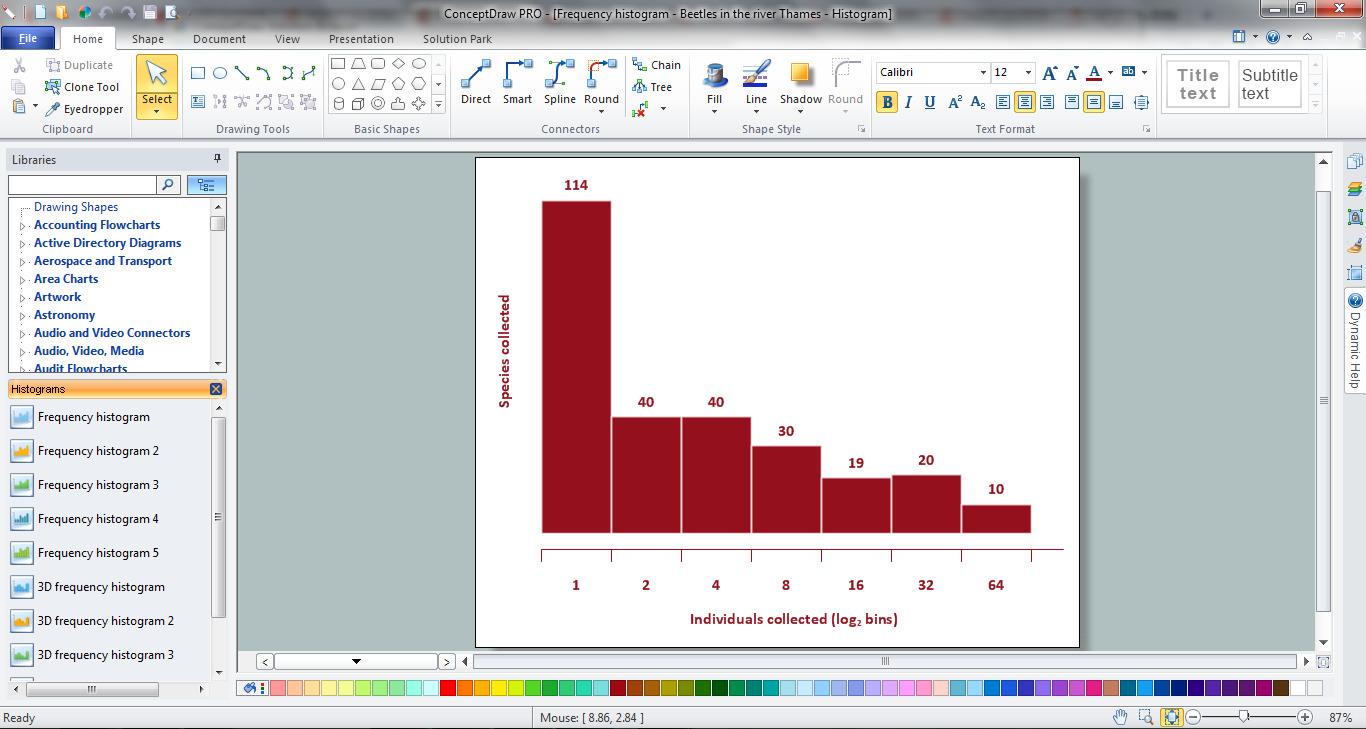
How to make histogram in ConceptDraw DIAGRAM ? ConceptDraw DIAGRAM diagramming and vector drawing software is the best choice for making professional looking Histograms. ConceptDraw DIAGRAM provides Histograms solution from the Graphs and Charts Area of ConceptDraw Solution Park.How To Make a Bubble Chart
Bubble diagrams solution extends ConceptDraw DIAGRAM software with templates, Using ConceptDraw Connectors, you can make a bubble chart in moments. Using ConceptDraw you will be able to make a bubble chart from the ready ConceptDraw library objects or make your own objects. The created diagram can represent ideas organization, in brainstorming processes, by teachers for explaining difficult ideas or for presentations.How To Make a Histogram?
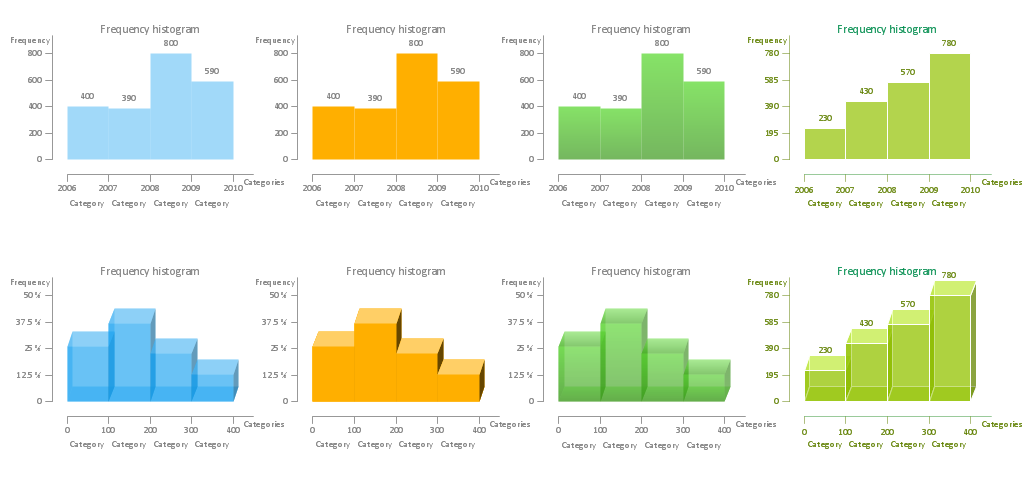
How to make a Histogram quick and easy? ConceptDraw DIAGRAM diagramming and vector drawing software extended with Histograms solution from the Graphs and Charts area will effectively help you in Histogram drawing.How Do You Make a Histogram?
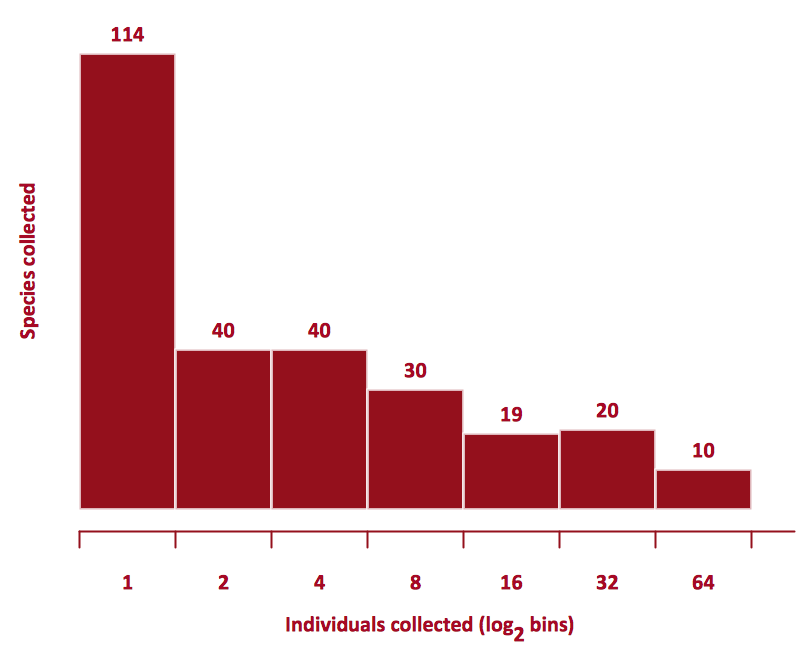
How do you make a histogram usually? Drawing of histogram is quite complex and lengthy process. Usually you have a set of data and you draw free-hand your diagram according to these data. But now thanks to the ConceptDraw DIAGRAM diagramming and vector drawing software extended with Histograms solution from the Graphs and Charts Area of ConceptDraw Solution Park this process became simple and fast.Make a Histogram
ConceptDraw DIAGRAM extended with Histograms solution from the Graphs and Charts area of ConceptDraw Solution Park lets you make a Histogram of any complexity in minutes.How Do You Make An Accounting Process Flowchart?
To describe the accounting processing use ConceptDraw Flowchart set of symbold created for Accounting data processing. Tips, Methods and Symbols on How to Create Flowcharts for an Accounting Information System.Best Program to Make Flow Chart Diagrams
ConceptDraw the best business process modeling tool to make flow chart diagrams. Start creating your own flowchart with ConceptDraw DIAGRAM and accomplish great results in the moment. This is the best program to make flow chart diagrams that gives users the ability to simply draw any type of flowchart. The fast creating visualization for the structural data with the vector stencils from object libraries by using RapidDraw technology makes ConceptDraw DIAGRAM the first program in drawing flow data.- How to Make SWOT Analysis in a Word Document | SWOT Template ...
- How to Make SWOT Analysis in a Word Document | SWOT analysis ...
- How To Make a Bubble Chart | Bubble diagrams with ConceptDraw ...
- Program to Make Flow Chart | BPR Diagram. Business Process ...
- Emergency Plan | Fire Exit Plan. Building Plan Examples | Fire and ...
- How to Make an Ansoff Matrix Template in ConceptDraw PRO ...
- How To Make a Bubble Chart | Cross-Functional Flowchart ...
- Program to Make Flow Chart | Data Flow Diagrams | Workflow ...
- How to Draw a Bubble Chart | How To Create a Bubble Chart | How ...
- Accounting Flowcharts | How to Make an Accounting Process ...
- How to Make SWOT Analysis in a Word Document | How to Make ...
- How to Make a Timeline | Timeline Diagrams | How to Create a ...
- How To Make an Effective PowerPoint Presentation | Program for ...
- How To Make a Bubble Chart | How To Create a Bubble Chart | How ...
- Program to Make Flow Chart | How To Create a Flow Chart in ...
- How Do You Make An Accounting Process Flowchart? | How to ...
- How To Make a Bubble Chart | How To Create a Bubble Chart ...
- How to Make SWOT Analysis in a Word Document | How to Create a ...
- How To Create a Bubble Chart | How To Make a Bubble Chart | How ...


