HelpDesk
How to Draw Chemistry Structures
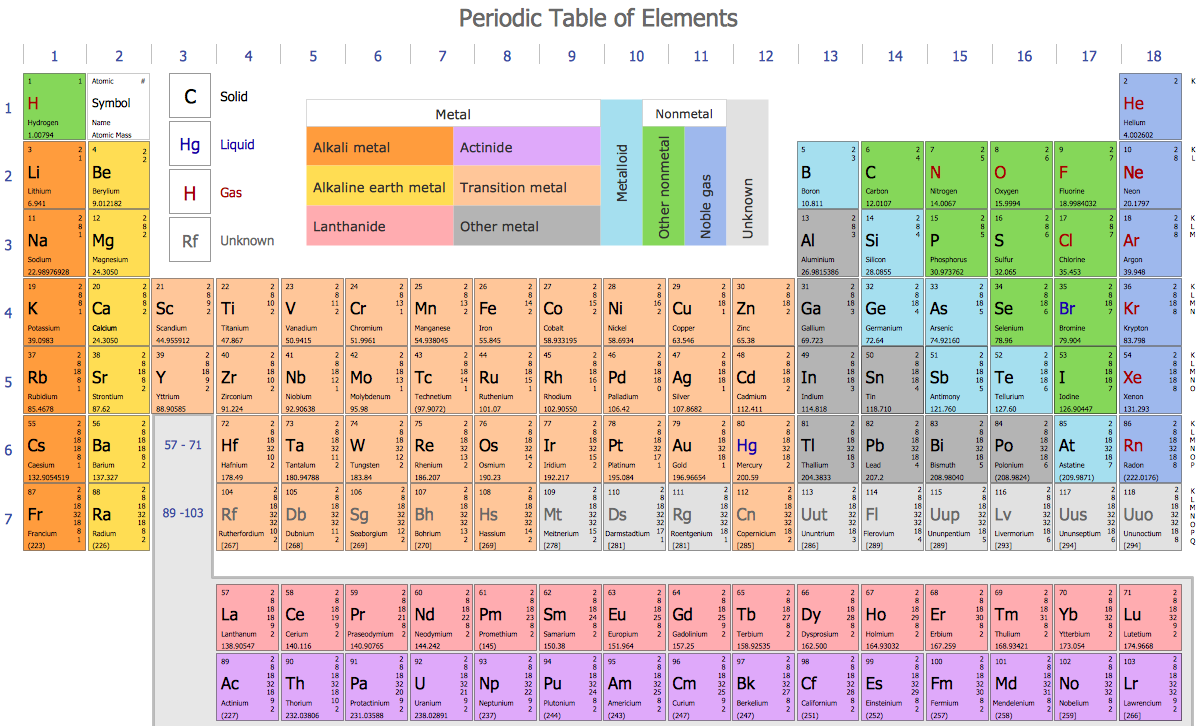
Making chemistry drawings for science and education purposes involves many different elements that can be managed using ConceptDraw PRO. ConceptDraw Chemistry solution can be used as a tool for creating chemical schemes and diagrams of chemical lab set-ups and labware, formulas, reaction schemes, and molecular structures. With ConceptDraw PRO you can easily create and communicate chemistry drawings of any complexity.HelpDesk
How to Draw a Pareto Chart Using ConceptDraw PRO
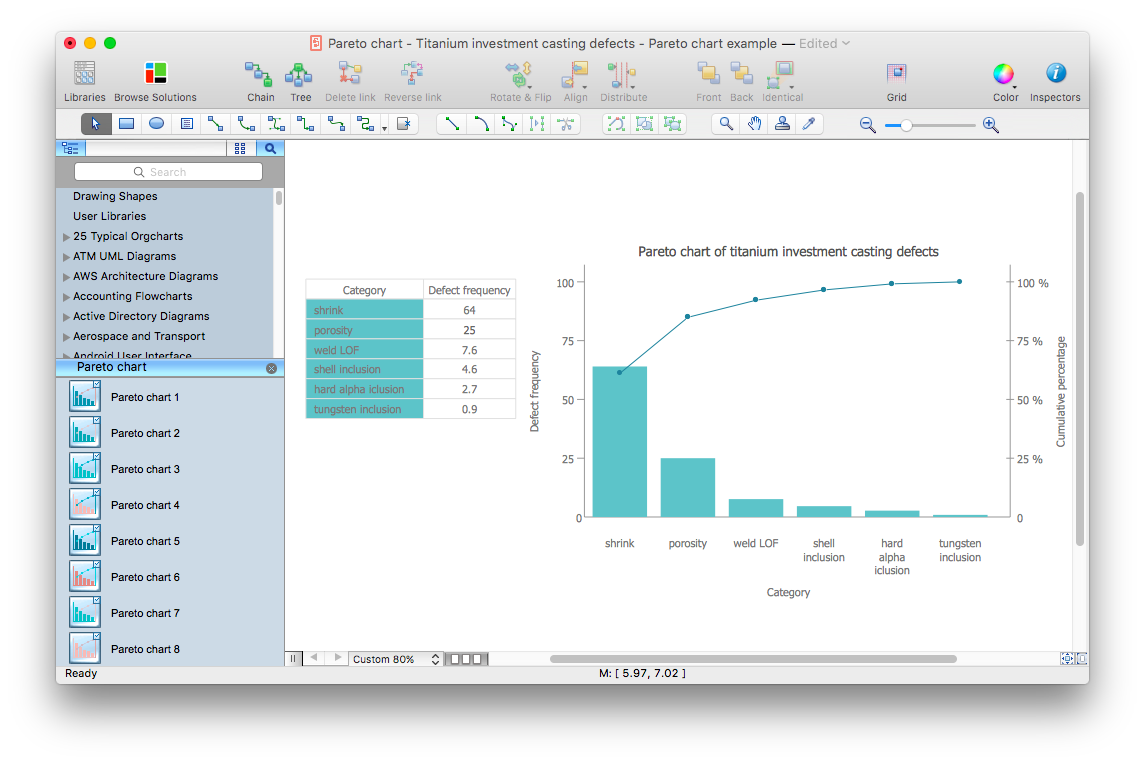
The Seven Basic Tools of Quality were picked as effective visual tool-set for identifying the root cause of quality-related problems within the workplace. Seven Basic Tools of Quality comprise of seven diagram that are diverse enough to be used to any business troubleshooting scenario, but simple enough that employees of all types can understand and apply them. One of these tools is a Pareto chart. It combines both a line graph and a bar chart, where the bar chart displays data values, and a line represents a total value. Pareto chart is used for quality control to identify the source of the quality problem. ConceptDraw Seven Basic Tools of Quality solution delivers a big set of vector stencil libraries and samples for each quality control diagram, including a Pareto chart.HelpDesk
How to Draw a Scatter Diagram Using ConceptDraw PRO
Scatter Diagrams are used to visualize how a change in one variable affects another. A Scatter Diagram displays the data as a set of points in a coordinate system. It combines these values into single data points and displays them in uneven intervals. A Scatter Diagram can be very useful to for identifying relationships between variables, for example the relationship of price and quality rating. Making a Scatter Diagram involves many different elements that can be managed using ConceptDraw Scatter Diagram solution.HelpDesk
How to Use ConceptDraw Sales Dashboard Solution
The interactive visual dashboard is a valuable tool for any sales team. Sales dashboard allows you to view and monitor sales indicators that are important for manager and sales staff . It helps to use the timely and reliable information to improve the quality of sales performance and increase sales revenues. ConceptDraw Sales Dashboard solution is a tool for both: sales manager and sales team. It provides the visualization of key performance indicators that are critical to the entire sales organization. The custom sales dashboard displays the real-time information on sales performance KPIs with the help of intuitive and easy-to-understand diagrams and charts. Sales Dashboard helps the entire team see where they are, and what needs to be done. With ConceptDraw PRO you can easily create a visual Sales Dashboard using Live Objects Technology.
HelpDesk
How to Draw a Pie Chart Using ConceptDraw PRO
A pie chart represents data, in a clear and easy to read round (pie) form. A circular pie chart is divided into sections (slice). Each "slice" depicts the It reflects the proportion of each component in the whole "pie". This type of chart is most often used for the visualization of statistical data. That is why pie charts are widely used in marketing. As pie charts show proportional proportional parts of a whole, they are good for various visual comparisons. For example, it is difficult to imagine a more intuitive way to show segmentation and market share. ConceptDraw PRO allows you to draw a simple and clear Pie Chart using the Pie Charts solution.
 Seating Plans
The correct and convenient arrangement of tables, chairs and other furniture in auditoriums, theaters, cinemas, banquet halls, restaurants, and many other premises and buildings which accommodate large quantity of people, has great value and in many cases requires drawing detailed plans. The Seating Plans Solution is specially developed for their easy construction.
- Make A Table Chart Online Free
- Online Table Chart Maker
- Make A Table Chart Online
- Seating Chart Template Free
- Table Chart Maker Online
- Make A Data Table Online Free
- Free Data Table Maker Online
- Flow Chart Online | Top 5 Android Flow Chart Apps | How To Create ...
- Seating Plans | Top 5 Android Flow Chart Apps | Entity Relationship ...
- Flow Chart Online | Top 5 Android Flow Chart Apps | ConceptDraw ...
- Seating Plans | Building Drawing Software for Design Seating Plan ...
- ConceptDraw Solution Park | Seating Plans | Make Calendar Online ...
- Table Seating Chart Template | How to Draw a Pie Chart Using ...
- Draw Erd Diagram Online
- Graph Maker Online
- Seating Chart Template | Seating Chart Template Free | Table ...
- Free Table Chart Maker
- Organizational Chart Templates | How to Draw an Organization ...
- Make Your Own Pie Chart Online Free


