HelpDesk
How to Draw a Pictorial Chart in ConceptDraw PRO
Pictorial Infographics is used to visually present data comparison. Pictorial charts use relative sizes or repetitions of the same icon, picture, or symbol to show data relation. Using a Pictorial chart to show business data patterns and trends will add much more efficiency to your business communications. Finding the right tool for the job can sometimes be tricky. Developing sophisticated and effective infographics can require toolsthat may span many different products. Fortunately, ConceptDraw PRO has everything you need to create polished Pictorial Infographics that beautifully and accurately represent your story, no matter how complex it may be.HelpDesk
How to Draw a Pie Chart Using ConceptDraw PRO
A pie chart represents data, in a clear and easy to read round (pie) form. A circular pie chart is divided into sections (slice). Each "slice" depicts the It reflects the proportion of each component in the whole "pie". This type of chart is most often used for the visualization of statistical data. That is why pie charts are widely used in marketing. As pie charts show proportional proportional parts of a whole, they are good for various visual comparisons. For example, it is difficult to imagine a more intuitive way to show segmentation and market share. ConceptDraw PRO allows you to draw a simple and clear Pie Chart using the Pie Charts solution.HelpDesk
How to Draw the Different Types of Pie Charts
Using the Pie Chart, you can visually estimate the relative contribution that different data categories contribute to a whole value. The pie chart displays the statistics in a visual format. The main use of pie charts to show comparisons. The larger piece of the pie, the more the value of this value compared to the rest. Various applications of pie charts can be found in business and education. For business, pie charts can be used to compare the success or failure of the goods or services. They may also be used to display the business market share.Gantt charts for planning and scheduling projects
ConceptDraw PROJECT is an excellent simple project scheduling software. It maintain classic project gantt charts and the line of professional reports on resources usage. It include handy critical path scheduling software tools and diagraming tools which helps prepare the presentation of project status. It include project tracking dashboard to keep project metrics upto date, also it have handy feature to export project management dashboard in excel file.
 Seven Basic Tools of Quality
Manage quality control in the workplace, using fishbone diagrams, flowcharts, Pareto charts and histograms, provided by the Seven Basic Tools of Quality solution.
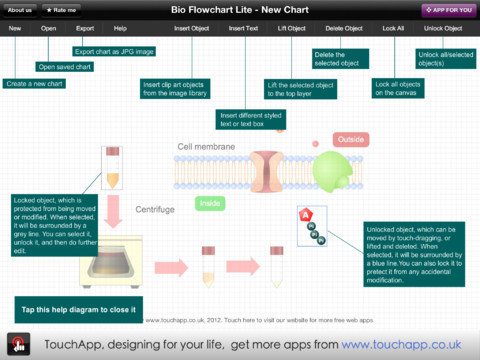
Bio Flowchart Lite
This app targets to help teachers and students to create vivid and professional biological flowcharts and diagrams in an easy way.- A Beautiful Chart Of Computer
- Chart Relative Computer
- How To Draw The Computer Department Organisation Chart
- How to Draw an Organization Chart | Basic Flowchart Symbols and ...
- Beautiful Chart Of Computer
- Gantt Chart For Computer Network Project
- How to Draw an Organization Chart | Digital Communications ...
- How to Draw an Organization Chart | Organization Chart Templates ...
- Make A Chart Of Resources With Classification And Example
- Organogram Software | How to Draw an Organization Chart ...
- Hand Made Chart In Computer
- Skype Presentation | Relative Value Chart Software | GUI ...
- Computer Relative Diagram
- How To Draw A Computer On Chart Paper
- How to Draw an Organization Chart | Examples of Flowcharts, Org ...
- Organogram Software | How to Draw an Organization Chart ...
- Information Technology Architecture | How to Draw an Organization ...
- Organogram Software | How to Draw an Organization Chart ...
- Hardware And Software Make A Chart
- Organogram Software | Organizational Structure | How to Draw an ...


