"In mathematics, the Euclidean algorithm, or Euclid's algorithm, is a method for computing the greatest common divisor (GCD) of two (usually positive) integers, also known as the greatest common factor (GCF) or highest common factor (HCF). ...
The GCD of two positive integers is the largest integer that divides both of them without leaving a remainder (the GCD of two integers in general is defined in a more subtle way).
In its simplest form, Euclid's algorithm starts with a pair of positive integers, and forms a new pair that consists of the smaller number and the difference between the larger and smaller numbers. The process repeats until the numbers in the pair are equal. That number then is the greatest common divisor of the original pair of integers.
The main principle is that the GCD does not change if the smaller number is subtracted from the larger number. ... Since the larger of the two numbers is reduced, repeating this process gives successively smaller numbers, so this repetition will necessarily stop sooner or later - when the numbers are equal (if the process is attempted once more, one of the numbers will become 0)." [Euclidean algorithm. Wikipedia]
The flowchart example "Euclidean algorithm" was created using the ConceptDraw PRO diagramming and vector drawing software extended with the Mathematics solution from the Science and Education area of ConceptDraw Solution Park.
Value Stream Mapping Symbols
VSM symbols are the best for a production process designing. The entire Value Stream Mapping method uses a graphical representation of the manufacturing process, factors' pros and cons, that all stakeholders can easily understand. Value Stream Mapping is a graphical technique that provides possibilities to improve analysis of a manufacturing process, at the stage of the transferring information or materials that required to deliver a product or service to the customer.Chart Audit
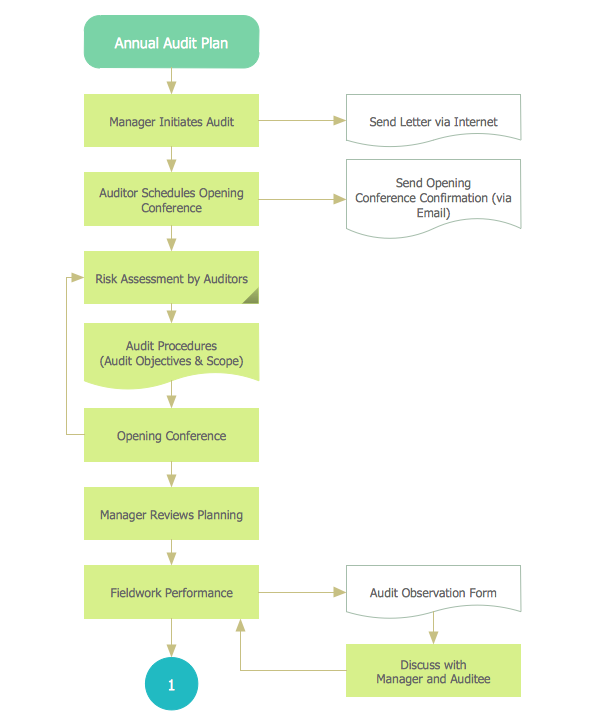
ConceptDraw PRO enhanced with Audit Flowcharts solution from the Finance and Accounting area of ConceptDraw Solution Park is a powerful diagramming and vector drawing software for designing professional looking Chart Audit of any complexity.Chart Audit is incredibly convenient for representing important information about audit process and audit planning process. It also helps auditors to define the problem areas and to elaborate the ways of their solving and effectiveness improvement.
Prioritization Matrix
You can design the Prioritization Matrix by hand on the paper, but we offer you the most easier way - to use the ConceptDraw PRO diagramming and vector drawing software extended with Seven Management and Planning Tools Solution from the Management Area.- Euclidean algorithm - Flowchart | Make A Flowchart To Elaborate ...
- How to Draw Biology Diagram in ConceptDraw PRO | Biology | Bio ...
- How to Create an Audit Flowchart Using ConceptDraw PRO | Audit ...
- Chart Audit | Chart Audits. Chart Auditor | Audit Flowchart Symbols ...
- Process Flowchart | Basic Flowchart Symbols and Meaning ...
- Process Flowchart | Basic Flowchart Symbols and Meaning | Audit ...
- Data flow Model Diagram
- Audit Flowcharts | Audit flowchart - Claim data processing | Process ...
- Process Flowchart | Cross-Functional Flowchart | Basic Flowchart ...
- Audit Flowcharts | Audit Flowchart Symbols | Basic Audit Flowchart ...
- Audit Steps | Audit Flowcharts | Audit Process Flowchart . Audit ...
- Biology Drawing Software | Biology Illustration | Biology Drawing ...
- Audit Steps | Audit Process | Audit Flowchart Symbols | Audit ...
- Basic Flowchart Symbols and Meaning | Audit Flowchart Symbols ...
- Audit Flowchart Symbols | Chart Audits. Chart Auditor | How to ...
- Audit Flowcharts | Audit Flowchart Symbols | Internal Audit Process ...
- Audit Flowcharts | Audit Flowchart Symbols | Process Flowchart ...
- Process Flowchart | Audit Flowcharts | Basic Audit Flowchart ...
- Audit Flowcharts | Chart Audit | Chart Audits. Chart Auditor | Chart ...
- Audit Flowcharts | Audit flowchart - Claim data processing | Process ...


