Make a Scatter Plot
Scatter Plot Graph
HelpDesk
How to Draw a Scatter Diagram

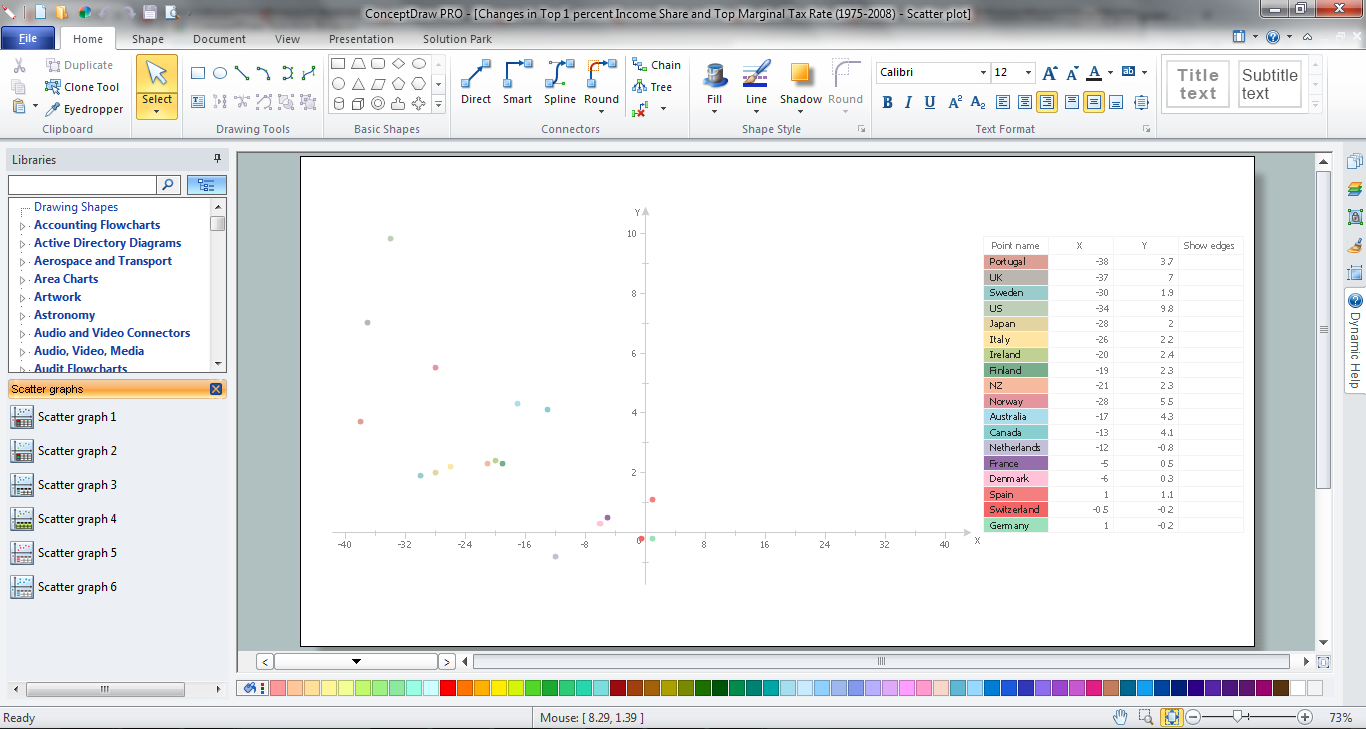
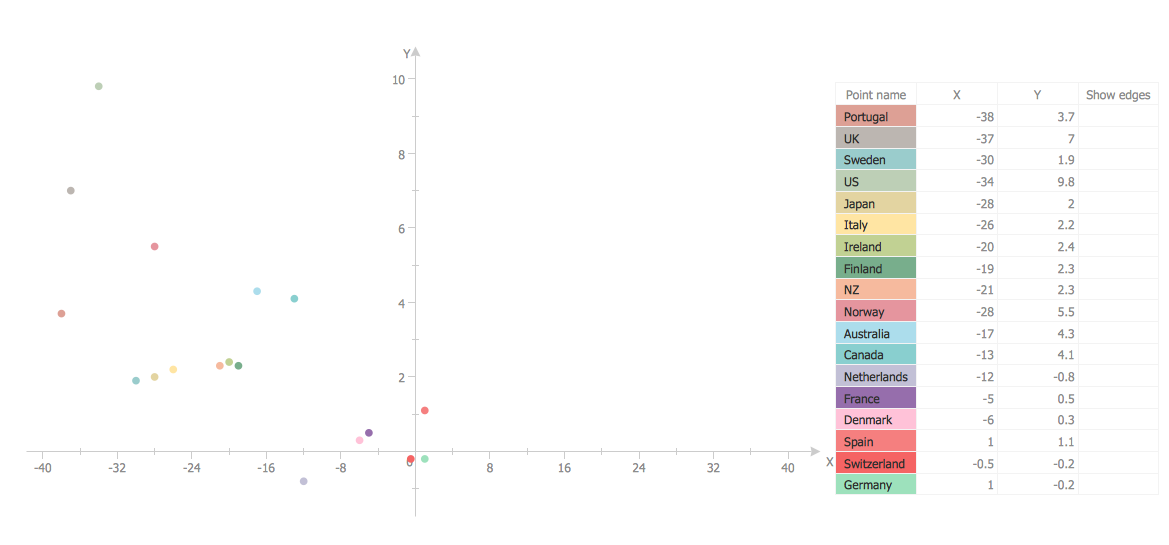
Scatter Chart Examples

Scatter Plot

Scatter Graph Charting Software

Blank Scatter Plot
Basic Diagramming


How to Create a Scatter Chart

Best Program to Make Diagrams

Simple Drawing Applications for Mac


The Best Drawing Program for Mac

Basic Diagramming


Best Vector Drawing Application for Mac OS X

Basic Diagramming

The Best Flowchart Software Available

Basic Diagramming

Bubble Chart
Bar Chart

- The Best Drawing Program for Mac | Scatter Chart Examples | Line ...
- Scatter Chart Examples | How to Create a Scatter Chart | Scatter ...
- Line Graph Charting Software | Scatter Chart Examples | Visual ...
- Correlation Dashboard | Scatter Chart Examples | The Best Choice ...
- Scatter Chart Examples | Blank Scatter Plot | Line Chart Examples ...
- How to Create a Scatter Chart | Scatter Chart Examples | Line Graph ...
- Scatter Diagrams | Scatter Diagram | Blank Scatter Plot | Scatter ...
- Scatter Chart Examples | Scatter Diagrams | Blank Scatter Plot ...
- Scatter Diagram | Scatter Chart Examples | Design elements ...
- Scatter Chart Examples
- Basic Diagramming
- Blank Scatter Plot | Scatter Chart Examples | Design elements ...
- Design elements - Correlation charts | Blank Scatter Plot ...
- Scatter Chart Examples | Blank Scatter Plot | Design elements ...
- Basic Diagramming | Line Chart Examples | Scatter Plot On Us ...
- Scatter Chart Examples | Blank Scatter Plot | Scatter Chart Analysis ...
- Scatter chart - MENA's (Middle East and North Africa's) real GDP ...
- Basic Diagramming | Line Graphs | Scatter chart - MENA's (Middle ...
- Design elements - Line graphs | Line Chart Examples | Scatter Chart ...
- Blank Scatter Plot | Design elements - Correlation charts | Scatter ...