HelpDesk
How to Create a Timeline Diagram in ConceptDraw PRO
A Timeline is a chart which displays a project plan schedule in chronological order. A Timeline is used in project management to depict project milestones and visualize project phases, and show project progress. The graphic form of a timeline makes it easy to understand critical project milestones, such as the progress of a project schedule. Timelines are particularly useful for project scheduling or project management when accompanied with a Gantt chart. It captures the main of what the project will accomplish and how it will be done. making a project timeline is one of the most important skills a project manager needs have. Making comprehensive, accurate timelines allows you getting every project off in the best way. ConceptDraw PRO allows you to draw a timeline charts using special library.HelpDesk
How To Create a PERT Chart
Project Evaluation and Review Technique (PERT) is a method of project tasks evaluation and analysis. PERT - is a method of analyzing the tasks required to complete the project. It includes analysis of the time required to complete each task, as well as the determination of the time required to carry out the whole project. PERT was developed to facilitate the planning of huge and complex projects. PERT is used for very large, complex, and non-standard projects. Technology implies the presence of uncertainty, making it possible to develop a schedule of the project without a precise information on details and time required for all of its components. The most popular part of PERT is a method of the critical path, based on the construction of the network schedule (PERT network diagram). ConceptDraw Office delivers you the best way to create PERT chart for your project using compatibility between ConceptDraw PROJECT and ConceptDraw PRO.HelpDesk
How to Draw a Divided Bar Chart in ConceptDraw PRO
A divided bar graph is a rectangle divided into smaller rectangles along its length in proportion to the data. Segments in a divided bar represent a set of quantities according to the different proportion of the total amount. A divided bar diagram is created using rectangular bars to depict proportionally the size of each category. The bars in a divided bar graph can be vertical or horizontal. The size of the each rectangle displays the part that each category represents. The value of the exact size of the whole must be known, because the each section of the bar displays a piece of that value. A divided bar diagram is rather similar to a sector diagram in that the bar shows the entire data amount and the bar is divided into several parts to represent the proportional size of each category. ConceptDraw PRO in conjunction with Divided Bar Diagrams solution provides tools to create stylish divided bar charts for your presentations.HelpDesk
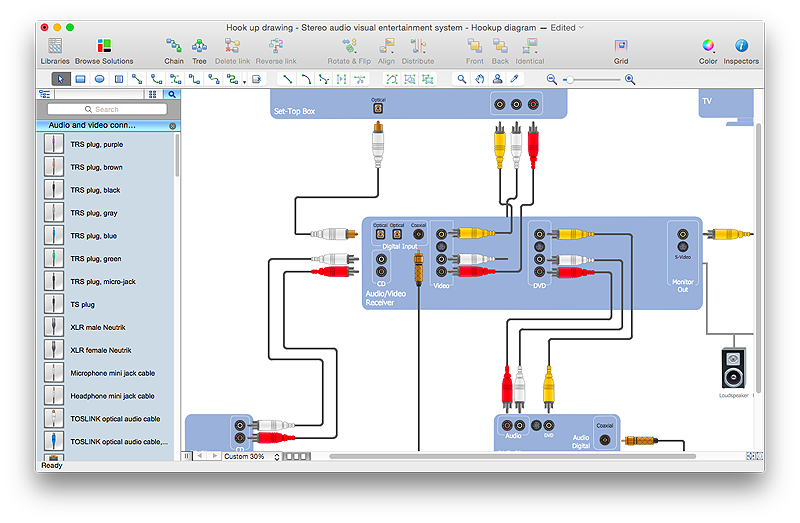
How to Create a Hook Up Diagram
Hook-up diagram of audio-video system is a detailed drawing showing the audio video connections in a correct manner so that system operates properly. Using the hook up diagram you can understand how the elements of your audio-video system should be installed. ConceptDraw PRO allows you to draw the Hook Up diagram of Audio-Video system easily using the set of special libraries provided by Audio and Video Connectors solution.- Flow Chart Online | How to Create a Timeline Diagram in ...
- Make A Chart Online Free
- Make A Chart Online
- Flow Chart Online | Online Flow Chart | How to Create a Timeline ...
- Flow Chart Online | How To Create a PERT Chart | How to Create a ...
- Make Charts Online
- Flow Chart Online | Process Flowchart | How to Create a Social ...
- Flow Chart Online | How to Create a Social Media DFD Flowchart ...
- Flow Chart Online | State Diagram Example - Online Store | Process ...
- How To Create Restaurant Floor Plan in Minutes | Flow Chart Online ...
- Flow Chart Online | How To Create a PERT Chart | Flow chart ...
- Flow Chart Online | Online Flow Chart | ConceptDraw Solution Park ...
- Make Pert Chart Online
- Flow Chart Online | Process Flowchart | Entity Relationship Diagram ...
- Flow Chart Online | Online Flow Chart | How to Create a Social ...
- How to Create a Social Media DFD Flowchart | Flow Chart Online ...
- Process Flowchart | Create Flow Chart on Mac | Flow Chart Online ...
- How To Create a PERT Chart | Example of DFD for Online Store ...
- Online Diagram Tool | Online Flow Chart | How to Create a Timeline ...
- Make Organizational Chart Online


