HelpDesk
How to Create a Picture Graph in ConceptDraw PRO
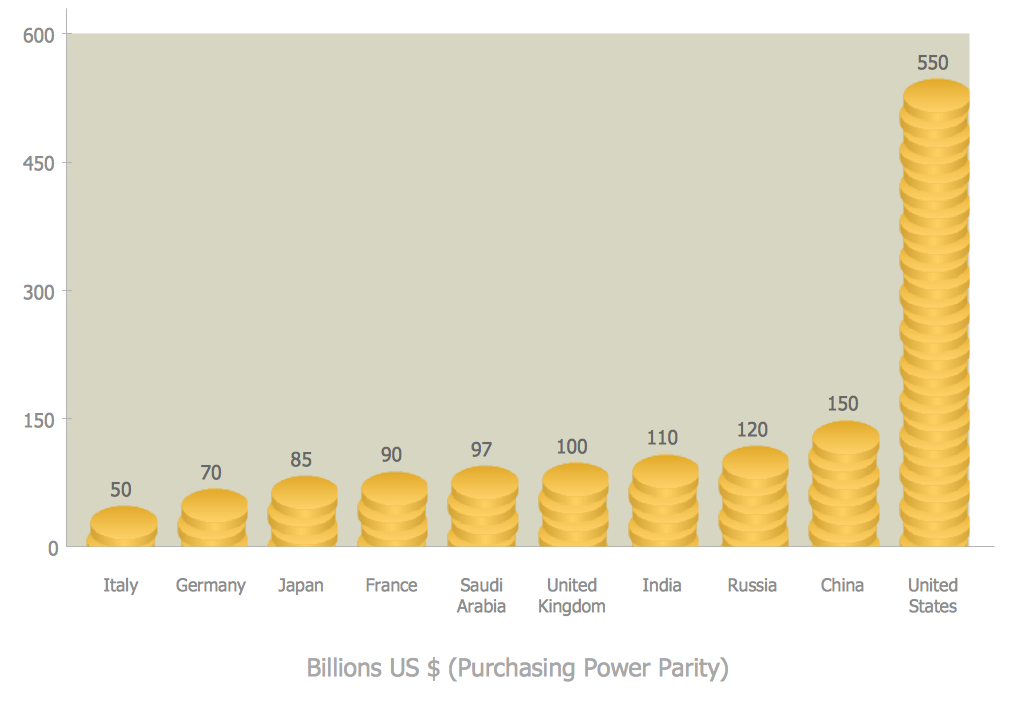
Picture Graphs are used commonly to represent non-complex data to a large audience. A Picture Graph is simple kind of marketing diagram used to show the relationship among various quantities. It include pictures or symbols to represent information visually. There are many cases when you have just some numbers to show and compare. This is not a reason to not use visual tools. You can produce a simple picture graph using memorable symbols to get the best visual presentation. Using specific symbols instead of regular colored bars makes picture graphs a much more descriptive tool. You can use tools from an existing library or find appropriate clipart in ConceptDraw’s collection. ConceptDraw PRO allows you to draw a simple and easy to understand Graph Charts using the special library.
 Bar Graphs
The Bar Graphs solution enhances ConceptDraw PRO v10 functionality with templates, numerous professional-looking samples, and a library of vector stencils for drawing different types of Bar Graphs, such as Simple Bar Graph, Double Bar Graph, Divided Bar Graph, Horizontal Bar Graph, Vertical Bar Graph, and Column Bar Chart.
- Bar Diagrams for Problem Solving. Create business management ...
- Picture Graphs | What Is a Picture Graph ? | How to Create a Picture ...
- Make Use Of Appropriate Graphics Graphs Sketches Photographs ...
- How To Make A Stacked Bar Graph
- Make Use Of Appropriate Graphics Graphs Photographs Sketches ...
- Basic Diagramming | The Best Drawing Program for Mac | Create ...
- Bar Graphs | How To Make a Concept Map | Images Of Line Pie Bar ...
- Bar Graphs | Pie Charts | Audit Flowcharts | Make Chart On Atm
- Bar Graph | Bar Chart Software | Chart Maker for Presentations ...
