 ConceptDraw Solution Park
ConceptDraw Solution Park collects graphic extensions, examples and learning materials
HelpDesk
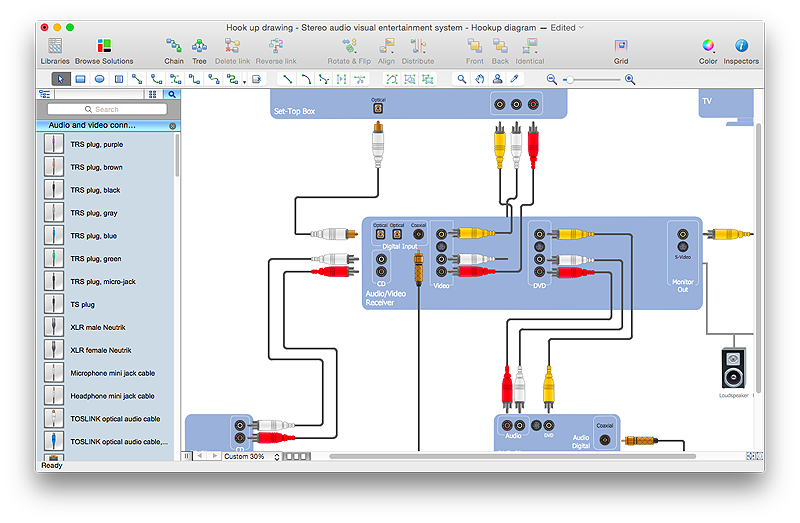
How to Create a Hook Up Diagram
Hook-up diagram of audio-video system is a detailed drawing showing the audio video connections in a correct manner so that system operates properly. Using the hook up diagram you can understand how the elements of your audio-video system should be installed. ConceptDraw PRO allows you to draw the Hook Up diagram of Audio-Video system easily using the set of special libraries provided by Audio and Video Connectors solution.HelpDesk
How to Create SWOT Analysis Template Using ConceptDraw PRO
SWOT-analysis is used to develop a marketing strategy. SWOT-analysis includes determining the strengths and weaknesses in the company's activity, potential external threats and opportunities and assesses their relative strategic competitors. ConceptDraw SWOT and TOWS Matrix Diagrams solution provide a set of SWOT matrix in which should be recorded and then compared the strengths and weaknesses of the enterprise and the market opportunities and threats. This comparison allows you to determine what steps can be taken for the development of your company and what problems need to be addressed urgently.HelpDesk
How to Make a Mind Map from a Project Gantt Chart
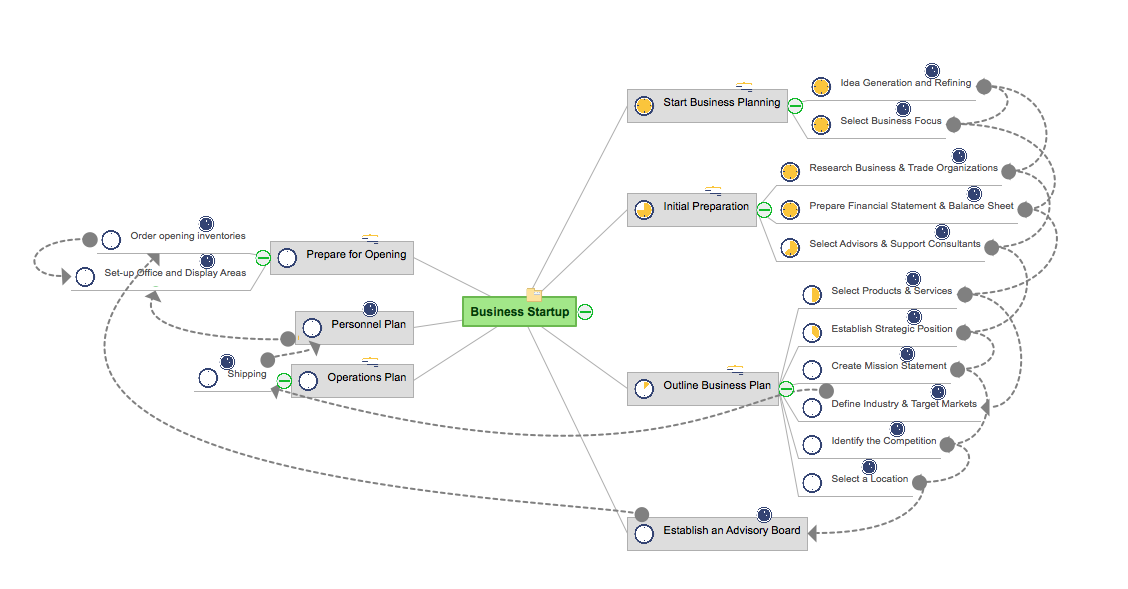
ConceptDraw Office allows you to see the project data from ConceptDraw PROJECT in a mind map structure by opening your project in ConceptDraw MINDMAP.HelpDesk
How to Draw an Organizational Chart Using ConceptDraw PRO
The organizational chart software is a valuable tool for modern business. It is important for any business to build a clear organizational structure that determines the responsibilities and relationships between different positions in the organization. The clear structured organization - means the clear structured business workflow, which is the core of success in the business. ConceptDraw PRO is an org chart software that allows you to draw an organizational structure of your company quickly and easily.HelpDesk
How to Draw a Line Chart Quickly
A common line chart is a graphical representation of the functional relationship between two series of data. A line chart that is created by connecting a series of data points together with a straight line is the most basic type of a line chart. A line chart can be used for depicting data that changes continuously over time. It is extensively utilized in statistics, marketing and financial business. ConceptDraw Line Graph solution provides the possibility to make 2D line charts quickly and effortlessly.- Flow Chart Online | How to Create a Timeline Diagram in ...
- Flow Chart Online | Online Flow Chart | How to Create a Timeline ...
- Make Charts Online
- Flow Chart Online | ConceptDraw Solution Park | How To Create a ...
- Flow Chart Online | Top 5 Android Flow Chart Apps | How To Create ...
- How To Create a PERT Chart | Flow Chart Online | How to Draw the ...
- Flow Chart Online | How To Create a PERT Chart | How to Create a ...
- Flow Chart Online | How To Create a PERT Chart | Flow chart ...
- Make A Chart Online Free
- Flow Chart Online | Online Flow Chart | How to Draw an ...
- Draw Chart Online
- ConceptDraw Solution Park | Flow Chart Online | How to Create ...
- How To Create a PERT Chart | Example of DFD for Online Store ...
- Flow Chart Online | How to Create a HR Process Flowchart Using ...
- Flow Chart Online | Online Flow Chart | Program Evaluation and ...
- Online Diagram Tool | Online Flow Chart | How to Create a Timeline ...
- Flow Chart Online | Online Flow Chart | ConceptDraw Solution Park ...
- Flow Chart Online | How to Create a Social Media DFD Flowchart ...
- Flow Chart Online | ConceptDraw Solution Park | Online Flow Chart ...
- Make Pert Chart Online


