HelpDesk
How to Create Cisco Network Diagram
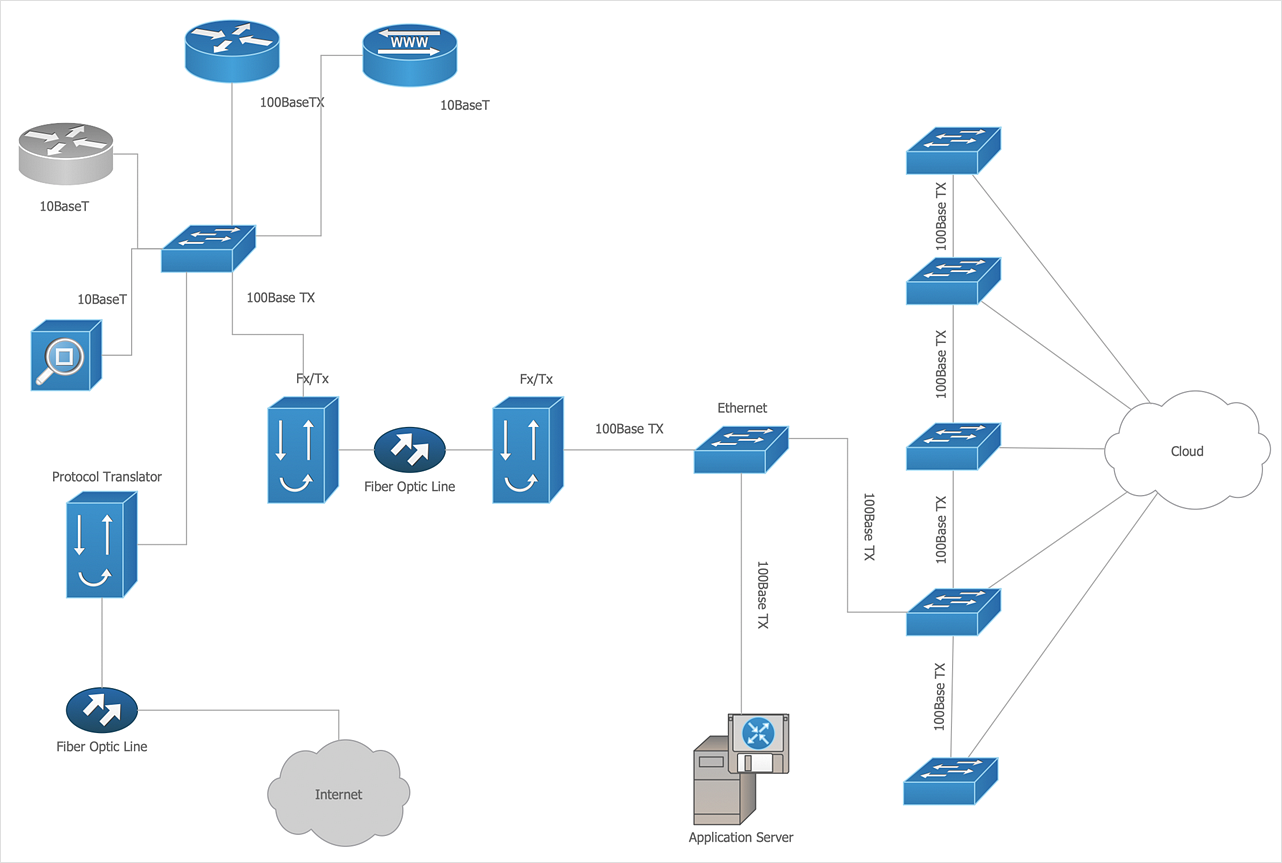
The easiest way to design Cisco Network diagram using standard Cisco product symbols is using ConceptDraw DIAGRAM powered by Cisco Network Diagrams solution. The Cisco Network Diagrams solution uses Cisco network symbols to visually document the topology and design of Cisco networks. Use a Cisco Network diagram to display the topology of a Cisco network. A diagram clearly depicting servers, computers, routers, and other parts of your network help to easily manage and control the network and the services it uses.
 Computer Network Diagrams
Computer Network Diagrams solution extends ConceptDraw DIAGRAM software with samples, templates and libraries of vector icons and objects of computer network devices and network components to help you create professional-looking Computer Network Diagrams, to plan simple home networks and complex computer network configurations for large buildings, to represent their schemes in a comprehensible graphical view, to document computer networks configurations, to depict the interactions between network's components, the used protocols and topologies, to represent physical and logical network structures, to compare visually different topologies and to depict their combinations, to represent in details the network structure with help of schemes, to study and analyze the network configurations, to communicate effectively to engineers, stakeholders and end-users, to track network working and troubleshoot, if necessary.
Product Overview
ConceptDraw PROJECT is a vigorous tool for managing single or multiple projects. It lets you determine all essential elements involved into project, control schedules, resources and finances, and monitor projects' progress in most effective yet simple manner.
 PM Response
The PM Response solution extends the functional abilities in project management for all three ConceptDraw products by helping to improve the response time to project changes, to plan on how to effectively respond on issues and events impacting the project. It supplies the project managers, team leaders, and all other project participants with wide abilities of iteration planning, creative collaboration, effective decision-making, discussions of the project layout approaches and solving the project challenges, lets them use mind mapping technique for iteration planning and applying the project changes, to represent the projects data as Mind Maps and use them to construct the clear plans, to convert project maps to project implementations, to use different kinds of Visual diagrams to solve the current project problems and to make correct decisions, to plan resources usage and to respond to changes in the project environment.
 Project Management Area
Project Management area provides Toolbox solutions to support solving issues related to planning, tracking, milestones, events, resource usage, and other typical project management functions.
HelpDesk
How to Manage Problem Solving Using Seven Management and Planning Tools
Stage by stage gouide on using visual tools to move toward solving the problem.
HelpDesk
How to Manage Multiple Projects on Mac
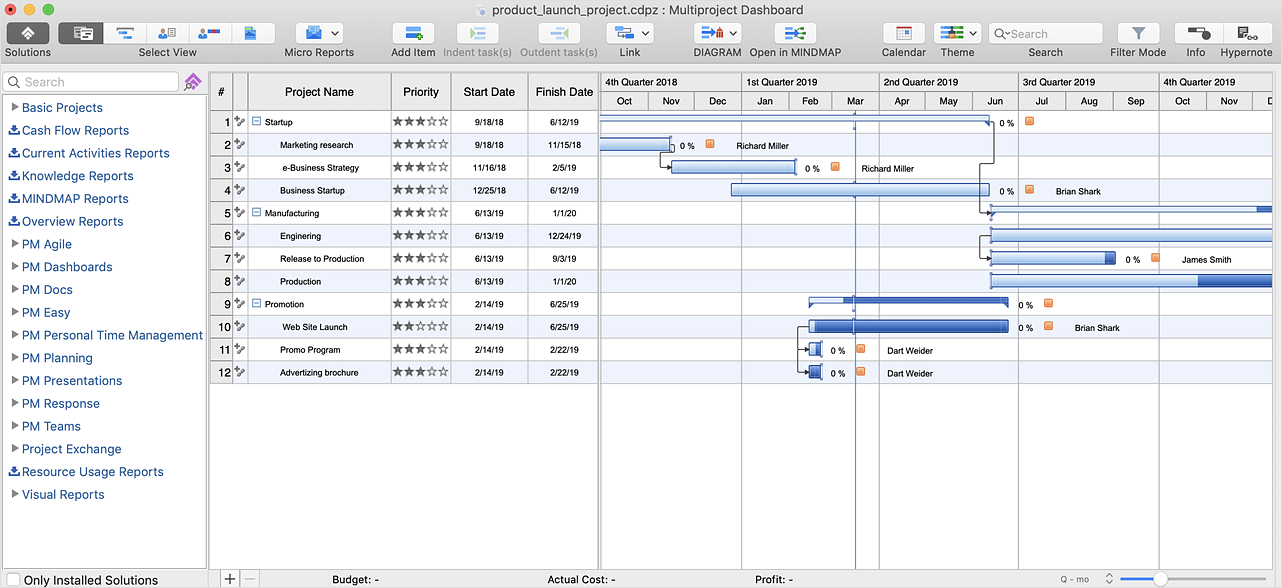
ConceptDraw PROJECT lets you track multiple projects at the same time. Multiproject Dashboard is intended exactly for this purpose.Business Diagram Software
When managing the projects, people, or networks, there are daily designed and used different types of Business diagrams, so the powerful drawing software will be very useful for this. ConceptDraw DIAGRAM with large quantity of business solutions will meet your needs and will help you convey your ideas successful and rapidly, no matter are you professional or beginner. It is the best choice for business specialists and technical professionals who need quickly and easily explore, visualize, and communicate information. ConceptDraw DIAGRAM business diagram software is the most powerful business software and relational charting software. Create advanced, completely customizable Business Process Diagrams, Business Flow Charts, Work Flow Diagrams, Organizational Charts, Audit diagrams, Marketing diagrams, Value Stream Maps, TQM diagrams, ERD diagrams, EPC diagrams, Cause and Effect diagrams, Infographics, Dashboards, and other Relational business diagrams from your data using the powerful drawing tools of ConceptDraw Solution Park.
 Seven Management and Planning Tools
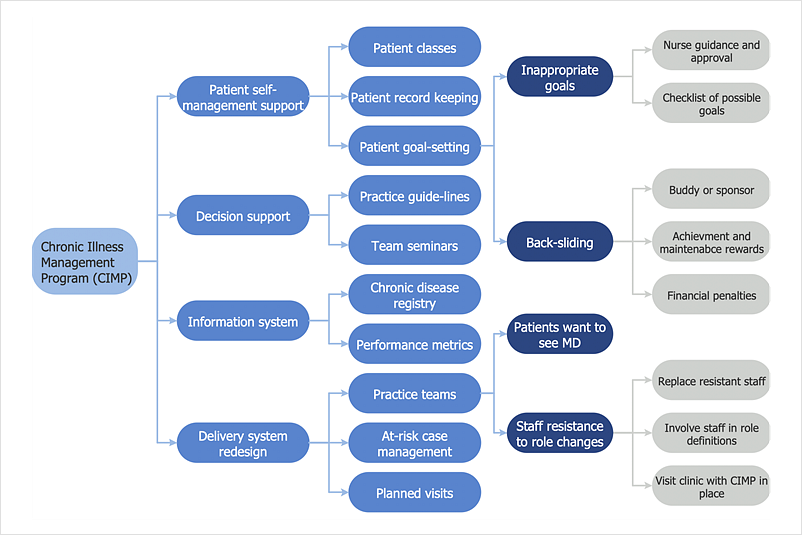
Seven Management and Planning Tools solution extends ConceptDraw DIAGRAM and ConceptDraw MINDMAP with features, templates, samples and libraries of vector stencils for drawing management mind maps and diagrams.
 Calendars
Calendars solution extends ConceptDraw DIAGRAM software with templates, samples and library of vector stencils for drawing the business calendars and schedules.
 ConceptDraw Solution Park
ConceptDraw Solution Park collects graphic extensions, examples and learning materials
HelpDesk
How to Manage Your Profile on ConceptDraw Website
When first registering on www.conceptdraw.com, you are given an automatically generated password. You are able to change it to your own unique password. Read in this post how you can do this.HelpDesk
How To Create a Prioritization Matrix
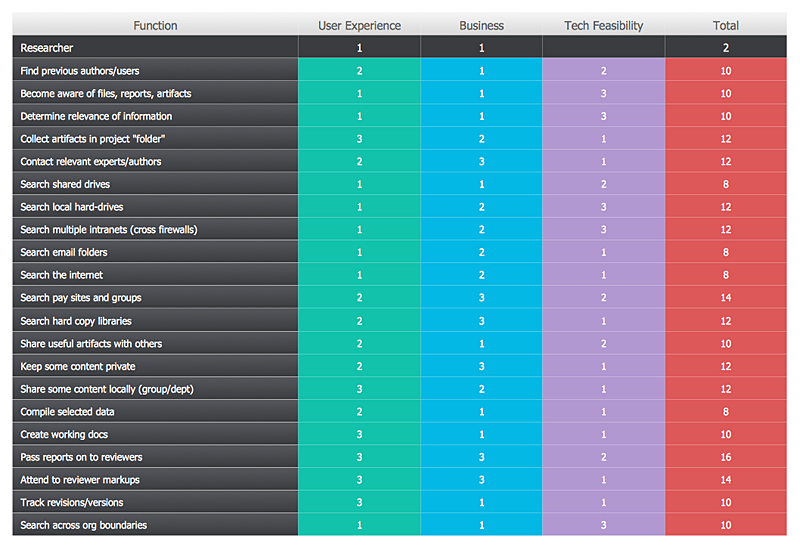
Making the prioritization matrix is helpful when all cannot be done at the same time. Prioritization matrix diagram shows the relationships between factors and this helps , to prioritize tasks and resources. This helps you to narrow down variants. By selecting and weighing options you can quickly determine the best choices and direct team to the best destinations. Prioritization matrix helps to identify a best way of implementing the most priority tasks. It is helpful in a case when you have limited resources. ConceptDraw solution for management and planning compiled from the Seven Management and Planning Tools, provides the ability to quickly build Prioritization Matrix diagrams for your project using special template.HelpDesk
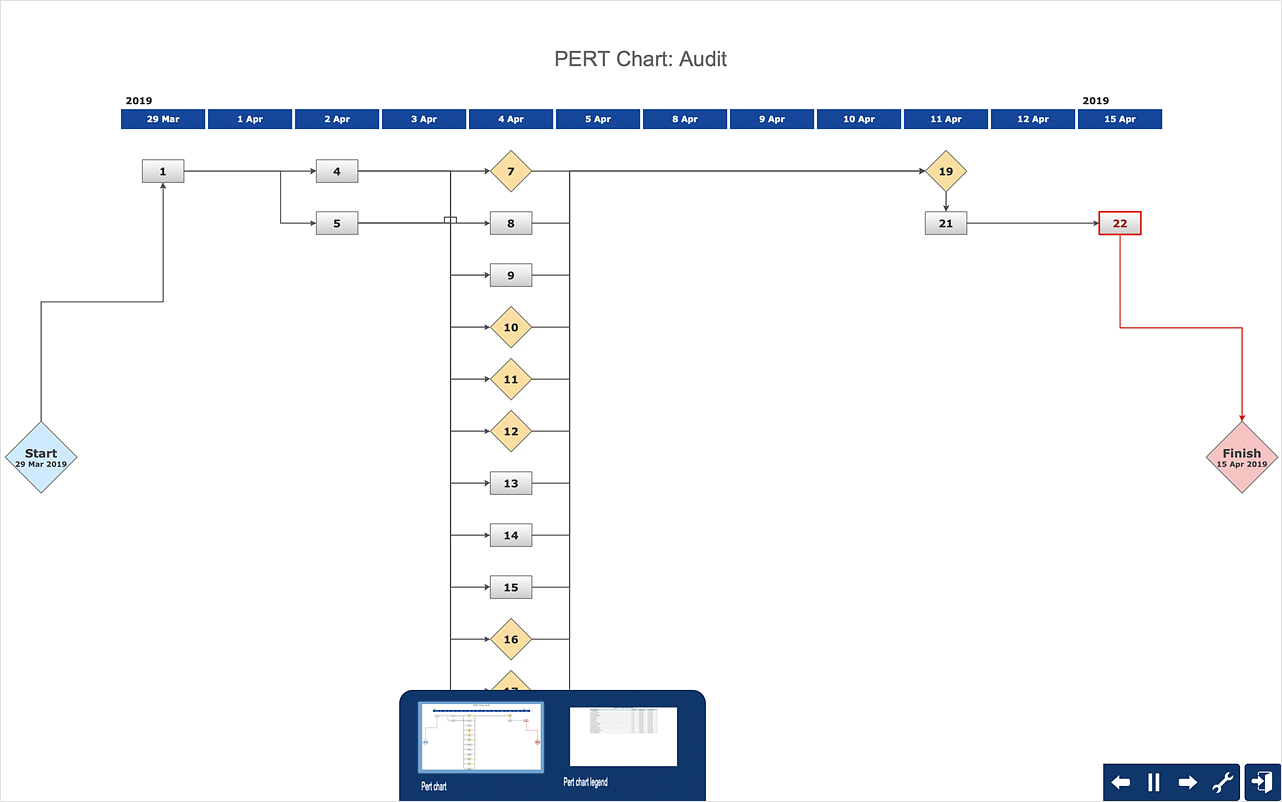
How To Create a PERT Chart Using PM Easy Solution
Project Evaluation and Review Technique (PERT) is a method of project tasks evaluation and analysis. PERT - is a method of analyzing the tasks required to complete the project. It includes analysis of the time required to complete each task, as well as the determination of the time required to carry out the whole project. PERT was developed to facilitate the planning of huge and complex projects. PERT is used for very large, complex, and non-standard projects. Technology implies the presence of uncertainty, making it possible to develop a schedule of the project without a precise information on details and time required for all of its components. The most popular part of PERT is a method of the critical path, based on the construction of the network schedule (PERT network diagram). ConceptDraw Office delivers you the best way to create PERT chart for your project using compatibility between ConceptDraw PROJECT and ConceptDraw DIAGRAM.HelpDesk
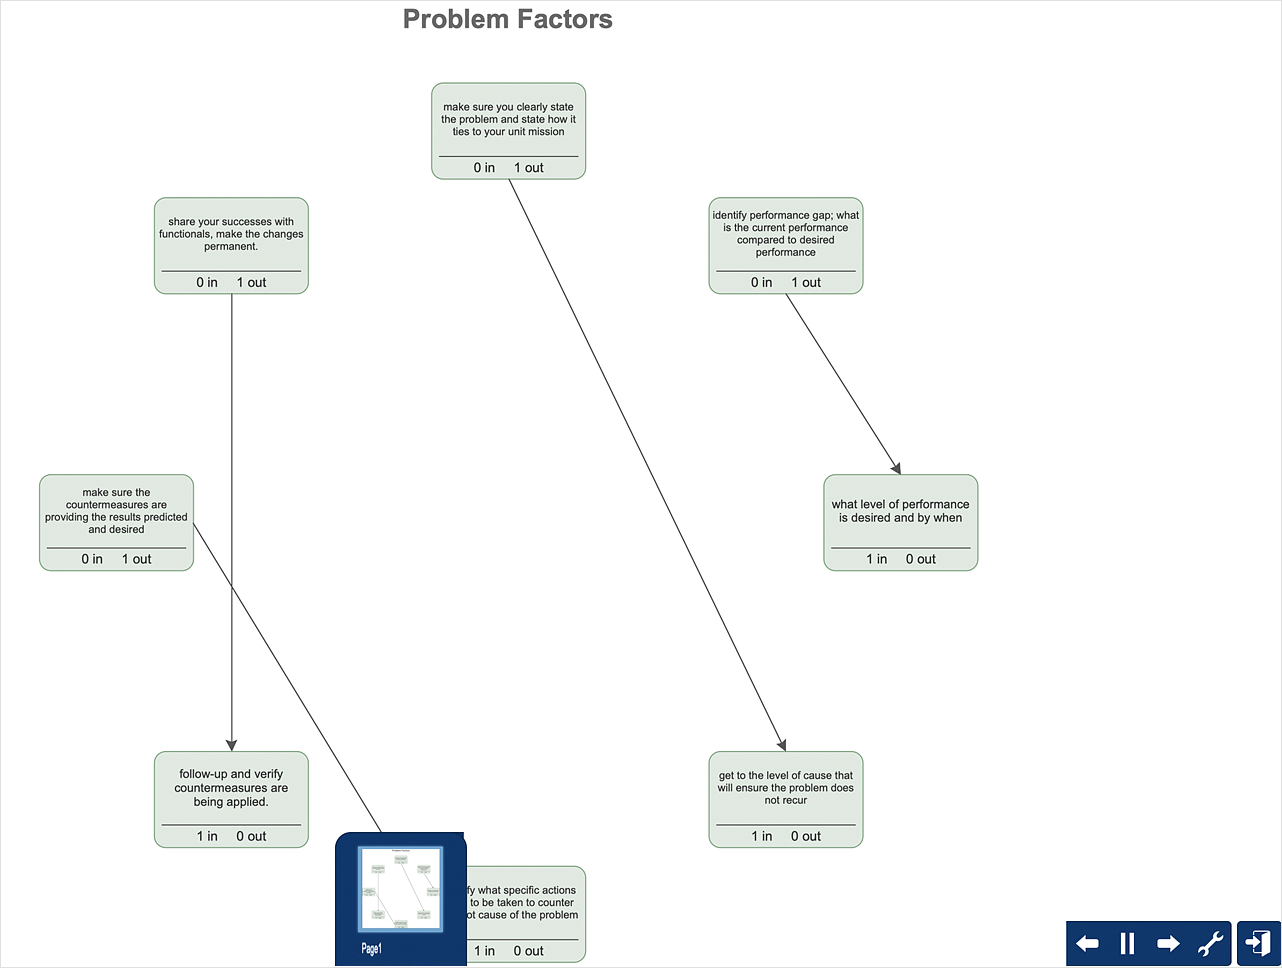
How To Create the Interaction (Relations) Diagram
Identify relationships between factors affecting a problem using interaction (relation) diagram. The ability to create a Relation diagram from a mind map is supported by the ConceptDraw Seven Management and Planning Tools solution.HelpDesk
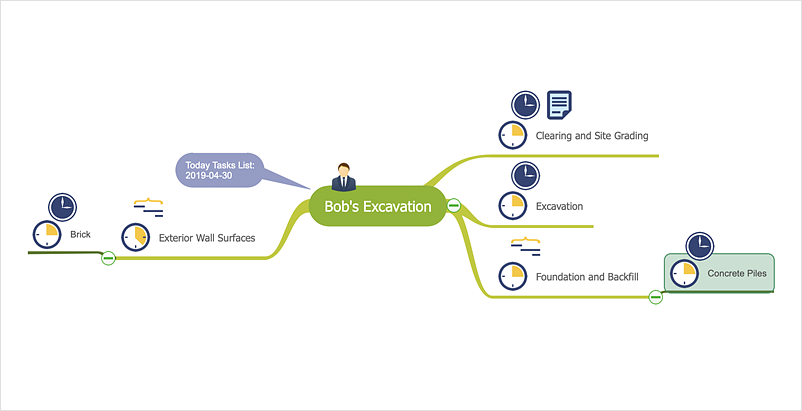
How to Manage a Multiple Project Participants Responsibilities With To-Do Mind Maps
All project participants are kept informed of their responsibilities in projects and can detail their tasks in a creative mind map format.HelpDesk
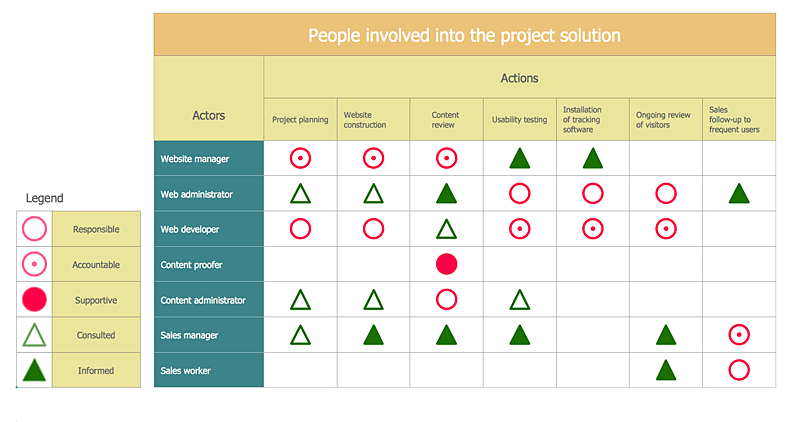
How To Create an Involvement Matrix
The Involvement Matrix can identify the distribution of responsibilities and identify roles in a group or team. This matrix can be used company-wide. The Involvement Matrix identifies participants who are involved in corrective actions. The Involvement Matrix is constructed for all highly prioritized corrective actions. It uses symbols to assign who participates, performs, consults, should be informed, checks the work, and accepts the results. Using visual diagrams keeps ideas clear and is very effective when discussing the problem and a description of the solution. They are great at helping to quickly see what stage of the problem-solving effort is currently underway. It defines the participants and their roles. The matrix displays all of the parties involved, defines their level of involvement, and the nature of their participation. The ability to create an Involvement Matrix is supported by the ConceptDraw Seven Management and Planning Tools solution.HelpDesk
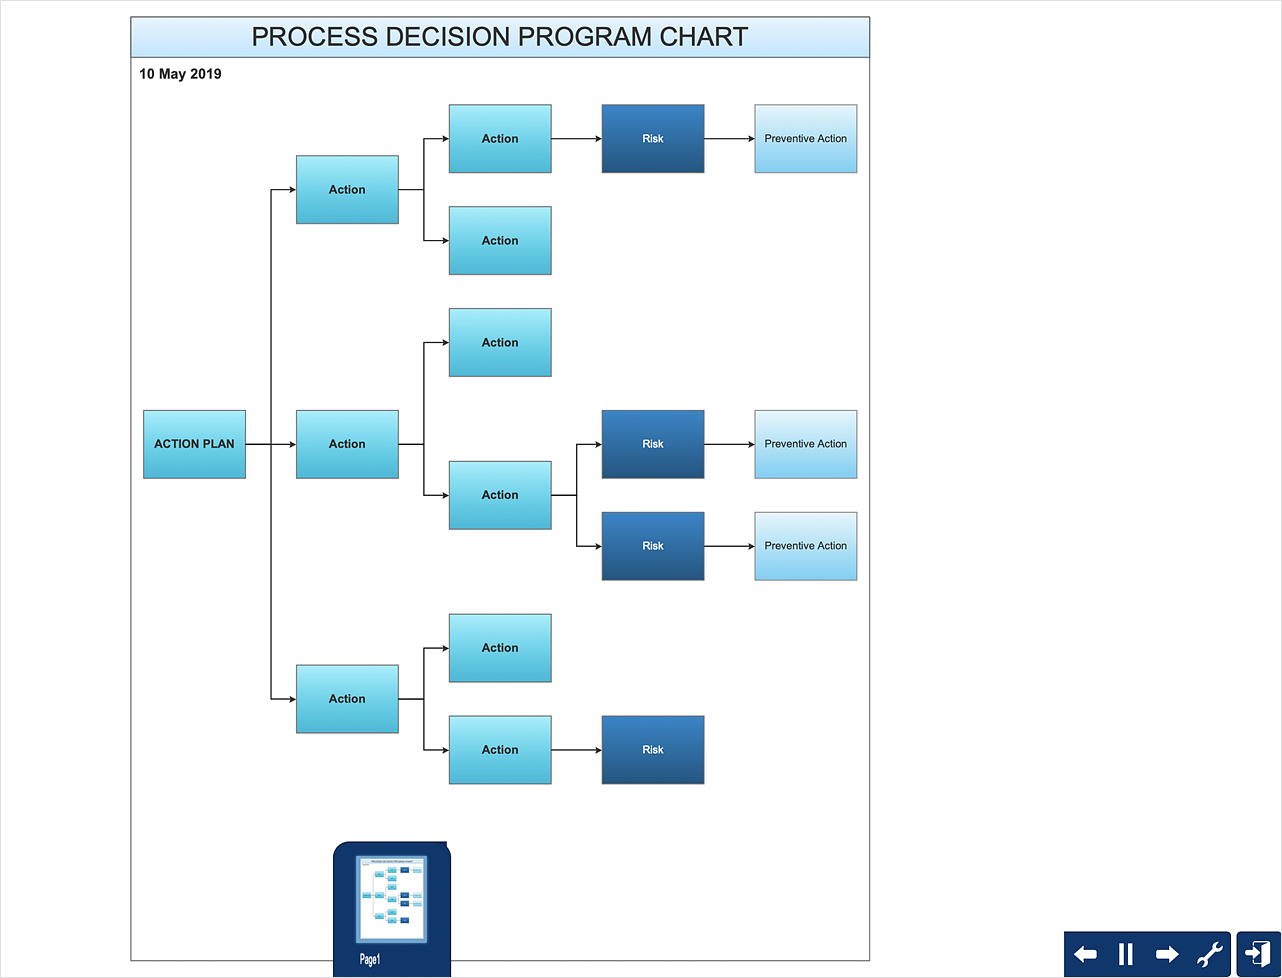
How To Create Risk Diagram (PDPC) Using Solutions
Risk diagram is used to identify possible risks in accomplishing corrective actions. With the Risks diagram, one analyzes each action separately in a tree of all actions and develops a preventive action in response to each potential obstacles or circumstances which may be a risk. The ability to create a Risk diagram from a mind map is supported by the ConceptDraw Seven Management and Planning Tools solution. This article describes how to identify possible risks when carrying out corrective actions, and define preventive actions.HelpDesk
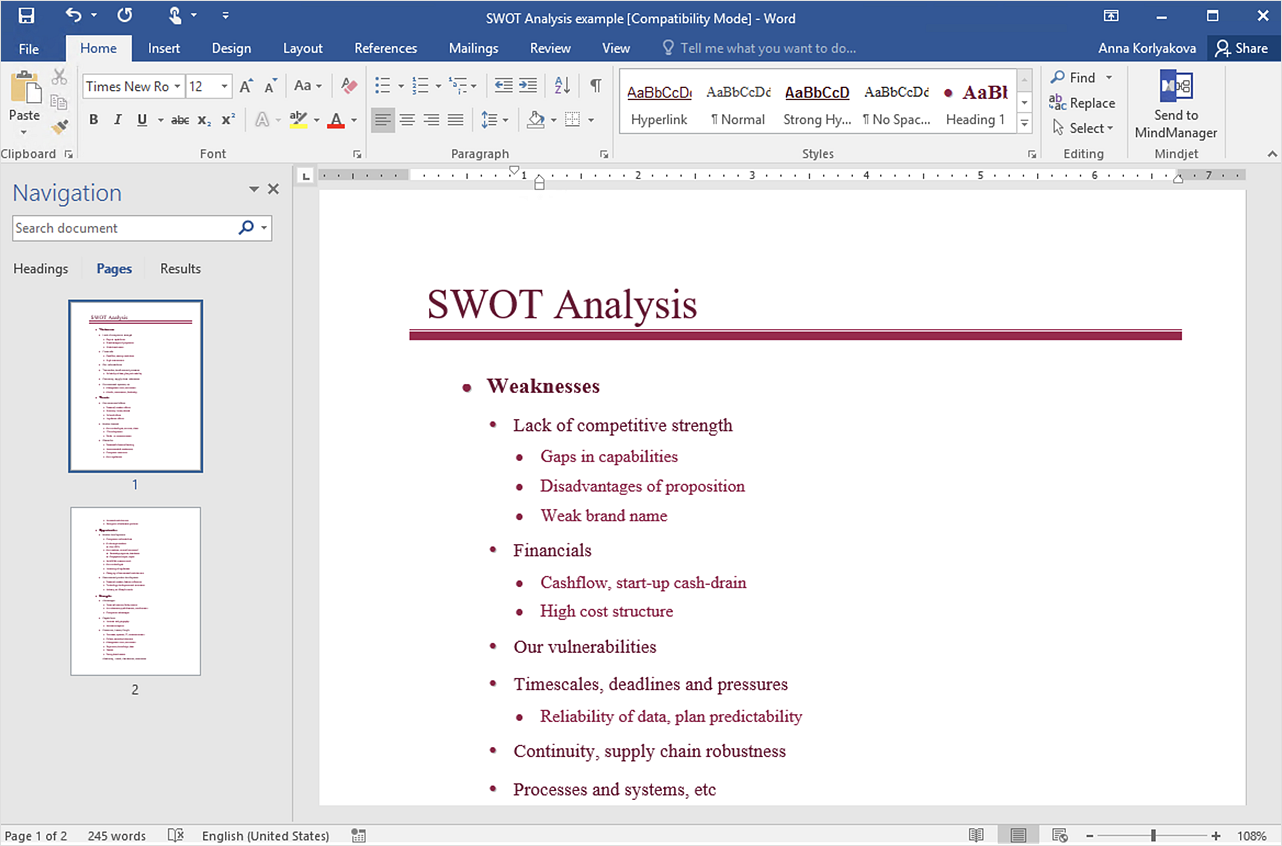
How to Make SWOT Analysis in a Word Document
A SWOT analysis is a strategic planning tool that helps to identify and compare strengths and weaknesses with opportunities and threats to make a decision and create an action plan. When performing a SWOT analysis, one can create a table split up into four columns so as to list each impacting element side-by-side for comparison, but typically it is conducted using a four-square SWOT analysis template. Using mind map allows you to collect and structure a piece of information involved in SWOT Analysis then, you can export your SWOT mind map into an MS Word document that allows you to present and collaborate your business strategic SWOT analysis matrix in MS Word document.- Bubble diagrams with ConceptDraw PRO | Total Quality ...
- Design Element: Active Directory for Network Diagrams | Active ...
- Network Diagram Software Backbone Network | Amazon Web ...
- AWS Architecture Diagrams | Network Architecture | Computer ...
- Mobile satellite TV network diagram | Building Networks | Mobile TV ...
- Active Directory diagrams with ConceptDraw PRO | Network ...
- Pyramid Diagram | Project management triangle diagram | Pyramid ...
- Network Protocols | Network Topologies | Logical network topology ...
- Conceptdraw.com: Mind Map Software, Drawing Tools | Project ...
- Enterprise architecture diagram
- Network Architecture | AWS Architecture Diagrams | Computer ...
- SharePoint server reference architecture for public-facing website ...
- Cisco Security. Cisco icons, shapes, stencils and symbols | Design ...
- Network Diagramming Software for Design Cisco Network Diagrams ...
- Enterprise architecture diagram
- Total Quality Management TQM Diagrams
- AWS Architecture Diagrams | Network Architecture | Computer ...
- Network diagrams with ConceptDraw PRO | Active Directory ...
- Satellite telecom network diagram
- Network Diagram Examples | Cisco Network Design | Draw Network ...
