The vector stencils library "Management pictograms" contains 72 management pictograms.
Use it to create your management infogram in the ConceptDraw PRO diagramming and vector drawing software.
The flat icons example "Management pictograms - Vector stencils library" is included in the solution "Marketing infographics" from the "Business infographics" area of ConceptDraw Solution Park.
Use it to create your management infogram in the ConceptDraw PRO diagramming and vector drawing software.
The flat icons example "Management pictograms - Vector stencils library" is included in the solution "Marketing infographics" from the "Business infographics" area of ConceptDraw Solution Park.
Diagramming software for Amazon Web Service icon set: Data Base
DataBase icons - Amazon AWS pro diagrams - AWS diagrams are part of architecturing tools provided with ConceptDraw Solution Park.Stakeholder Management System using Onion Diagram
Stakeholder management is a critical component to the successful delivery of any project, programme or activity. ConceptDraw DIAGRAM is a powerful diagramming and vector drawing software. Now, thanks to the Stakeholder Onion Diagrams Solution included to the Management Area of ConceptDraw Solution Park, ConceptDraw DIAGRAM became also unique stakeholder management system design software.Network Security
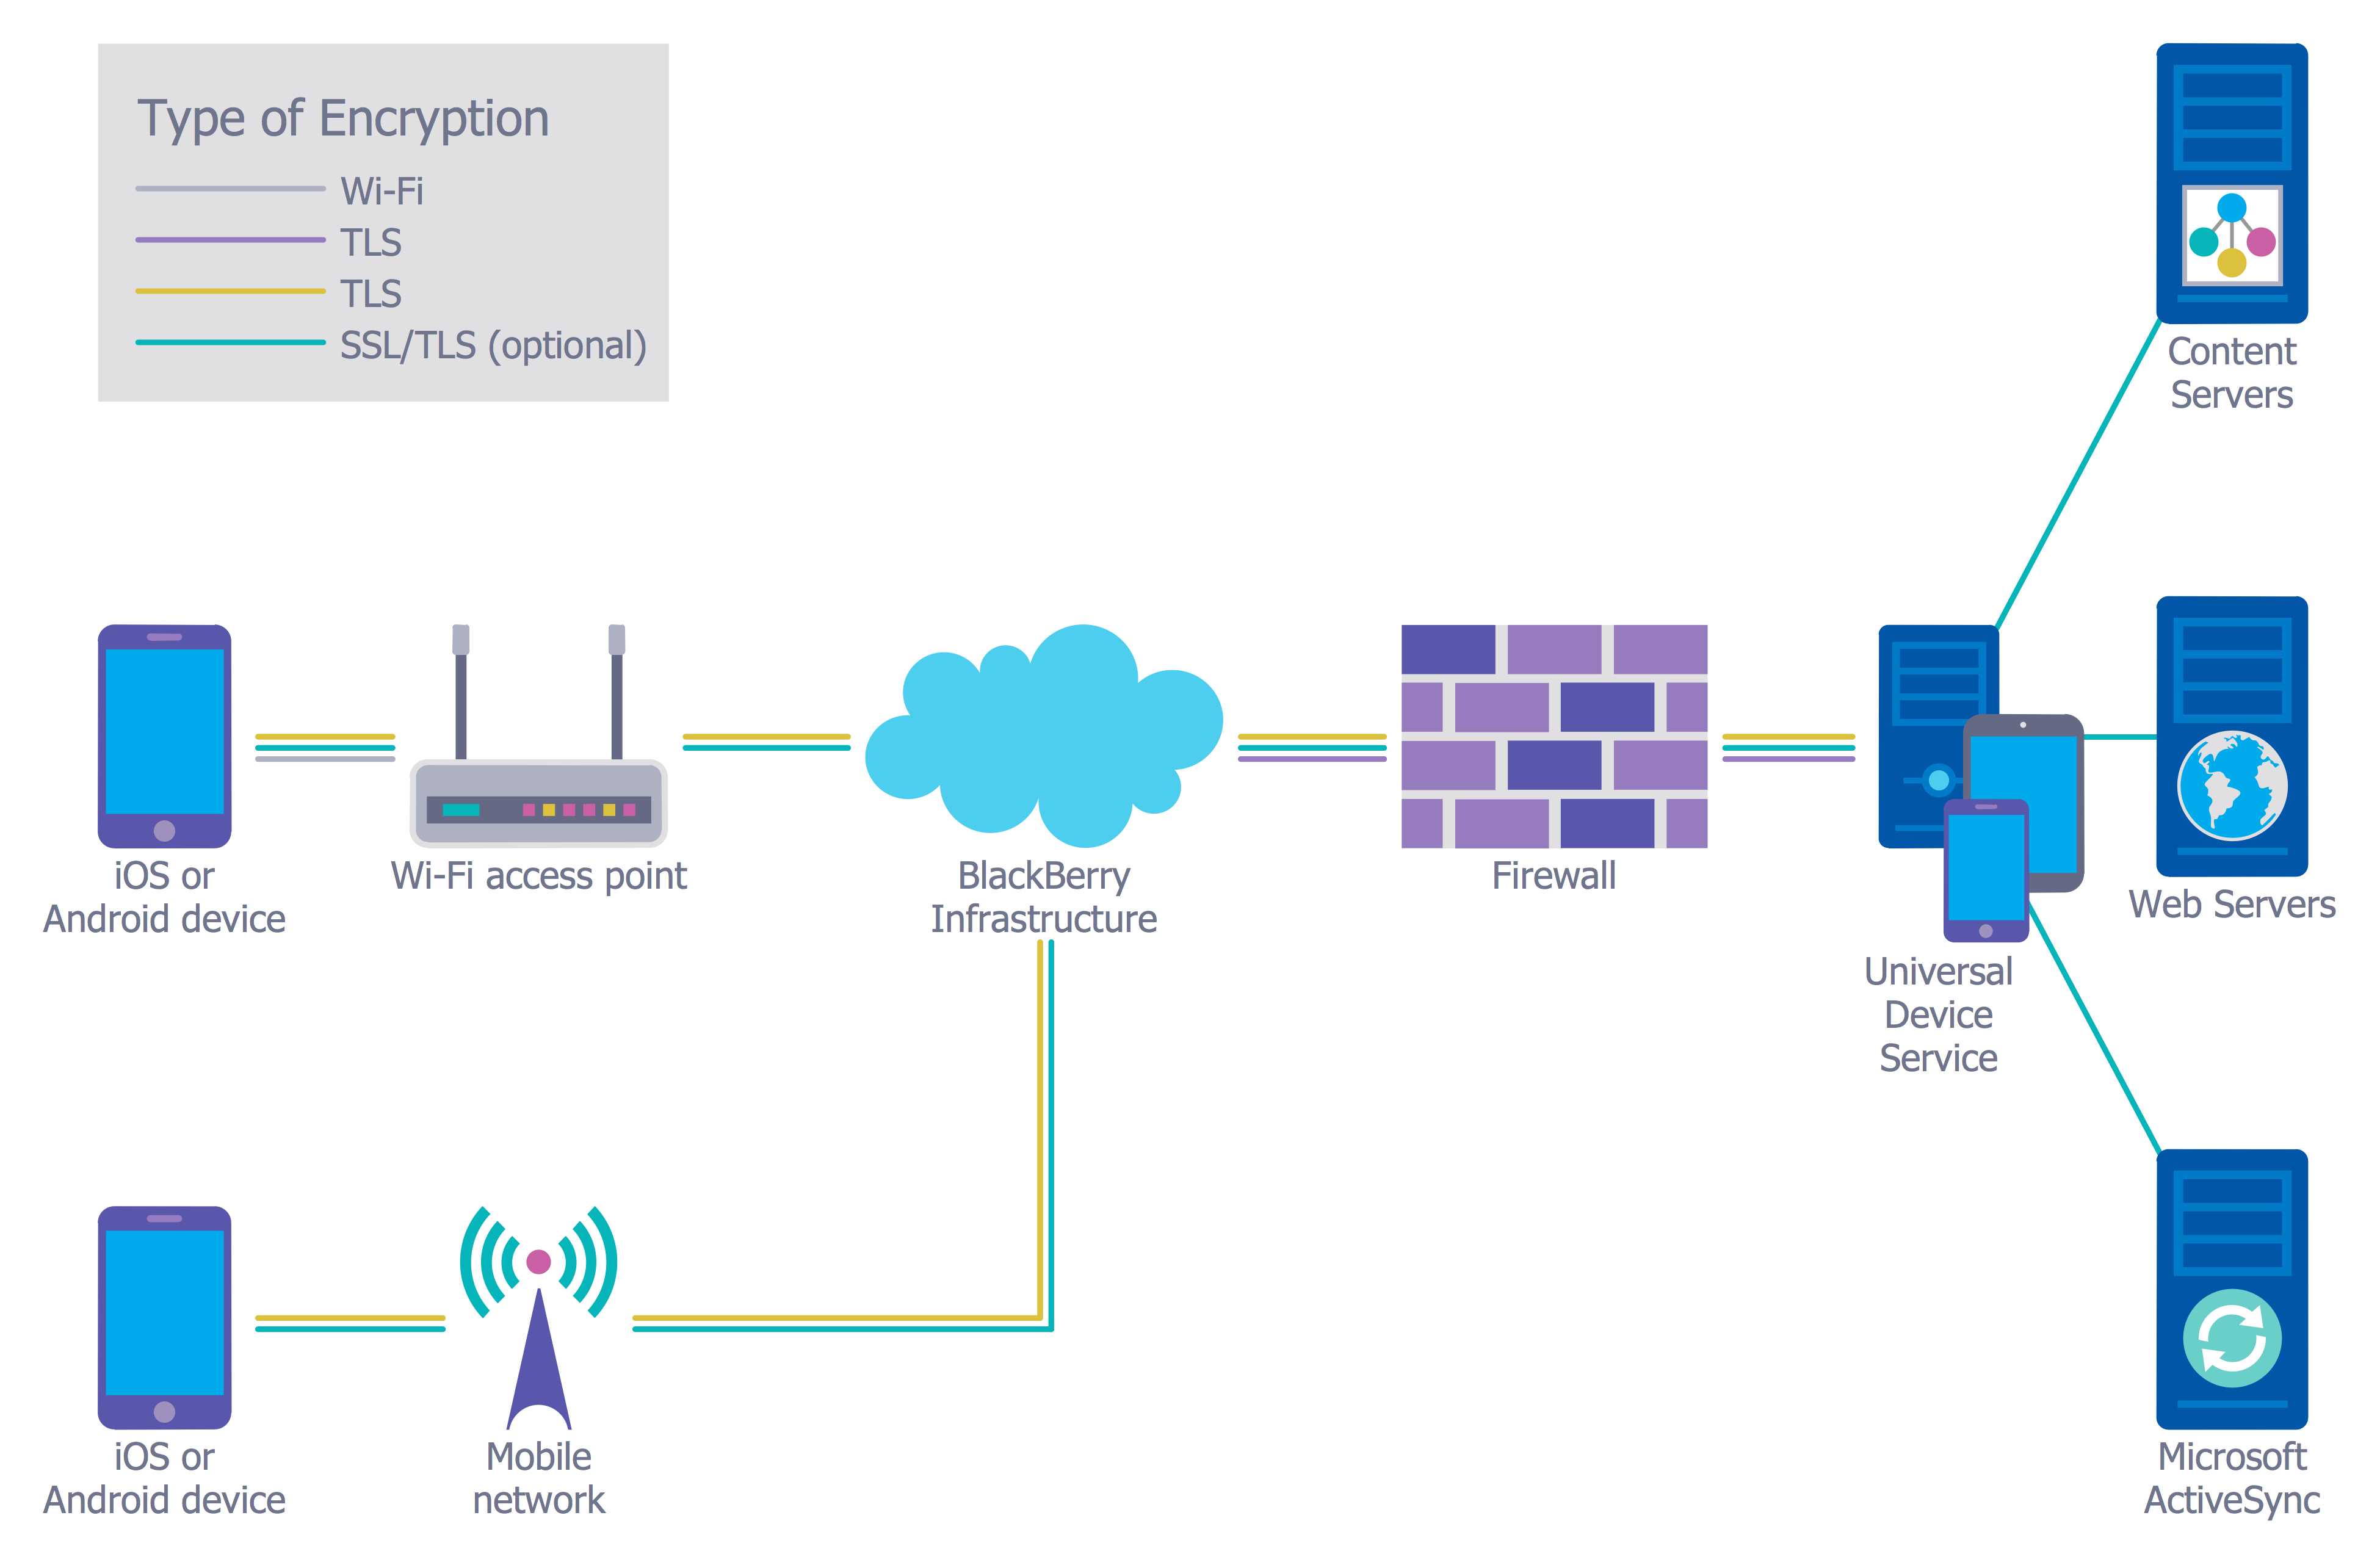
The Internet is a giant computer network which connects computers all over the world. It is integral part of human society and business. But the serious question for network engineers, designers, lawmakers and enforcers is the need for protect the Internet networks from the Internet crimes, hacking and attacks. There are quite a number of hardware, software and physical methods of protection against them. The samples you see on this page were created in ConceptDraw DIAGRAM using the tools of Network Security Diagrams Solution for ConceptDraw DIAGRAM software. They show protection networks with Firewalls and other network security devices.The vector stencils library "Management pictograms" contains 72 management pictograms.
Use it to create your management infogram in the ConceptDraw PRO diagramming and vector drawing software.
The flat icons example "Management pictograms - Vector stencils library" is included in the solution "Marketing infographics" from the "Business infographics" area of ConceptDraw Solution Park.
Use it to create your management infogram in the ConceptDraw PRO diagramming and vector drawing software.
The flat icons example "Management pictograms - Vector stencils library" is included in the solution "Marketing infographics" from the "Business infographics" area of ConceptDraw Solution Park.
 Critical Infrastructure Sectors
Critical Infrastructure Sectors solution for ConceptDraw DIAGRAM software provides a set of examples and vector stencil libraries for designing infographics and diagrams about means for the most efficient protection of critical infrastructure, energy sector, and rapid recovery in the case of disruptions. Illustrate your projects on the prevention of physical, environmental, and cyber threats, development of information technology and detection equipment. Improve your projects in communications, financial services, emergency services, homeland security, cybersecurity to solve critical issues efficiently and decrease the detrimental effects of disruptions on society and citizens. Show the results of testing new technologies and newest equipment for critical infrastructure protection and increasing resilience.
Flowchart Definition
Flowchart definition - A Flowchart is a diagram that graphically represents the structure of the system, the flow of steps in a process, algorithm, or the sequence of steps and decisions for execution a process or solution a problem. For depiction the steps there are used specific shapes and graphic symbols which are linked by lines and directional arrows. The main standard shapes are rectangle or box, rounded box, diamond, circle. A Flowchart is a convenient way to observe the follow the process from beginning to end, it lets improve the work of process, highlight the key elements and detach not essential or even excessive steps. The Flowcharts can represent different levels of detail: High-Level Flowchart, Detailed Flowchart, and Deployment or Matrix Flowchart. They are incredibly useful for programmers when developing the programs of any complexity and on any high level language. Create your own Flowcharts using the ConceptDraw DIAGRAM diagramming and vector drawing software and powerful tools of Flowcharts solution from "Diagrams" area.
 Workflow Diagrams
Evaluate all advantages of workflow diagram software ConceptDraw DIAGRAM extended with the Workflow Diagrams solution that includes workflow examples and samples, workflow diagram template, a library of workflow diagram symbols and pictorial vector clipart for drawing visual and intuitively understandable Workflow diagrams. Design pictorial Work flow chart or Work flow diagram easier than ever, use them for documentation and implementation purposes, export in a variety of common graphics formats and share with colleagues. Extend the already wide area Work flow diagrams' applications that are used today in the manufacturing industry, software development, HR, medicine, banking and finance sphere, education, military, government, business, e-commerce, and many other fields.
Value Stream Mapping Template
The Value Stream Map is one of the key tools of lean practitioners. It helps aptly describe the manufacturing processes both complex and simple. It supports process improvement, allows identifying waste, and reducing process cycle times. Use ConceptDraw DIAGRAM extended with Value Stream Mapping solution to document processes starting with a professionally designed Value Stream Mapping template.
 Stakeholder Onion Diagrams
The Stakeholder Onion Diagrams solution supplies ConceptDraw DIAGRAM with powerful tools to simplify the process of creating Stakeholder Onion Diagrams. It includes the set of pre-made vector objects and templates for a quick start, and collection of examples illustrating the solution's power. This solution is useful for all specialists in management and business, especially for those who prefer to use the newest progressive tools.
 Environmental, Social, and Corporate Governance
The Environmental, Social, and Corporate Governance solution with diversity of drawing tools, libraries of pre-made vector elements, and thematic samples is the best to illustrate the key points of ESG, specify ESG criteria and ESG risks. This helps investors evaluate potential investments and avoid investment losses. Outline ESG factors and ESG standards to protect the environment, avoid climate change and biodiversity loss, illustrate principles of sustainability, waste management, supply chain management, and the importance of the use of renewable energy and renewable resources. Depict easily the policies of the companies that adhere to ESG standards.
Flowchart on Bank. Flowchart Examples
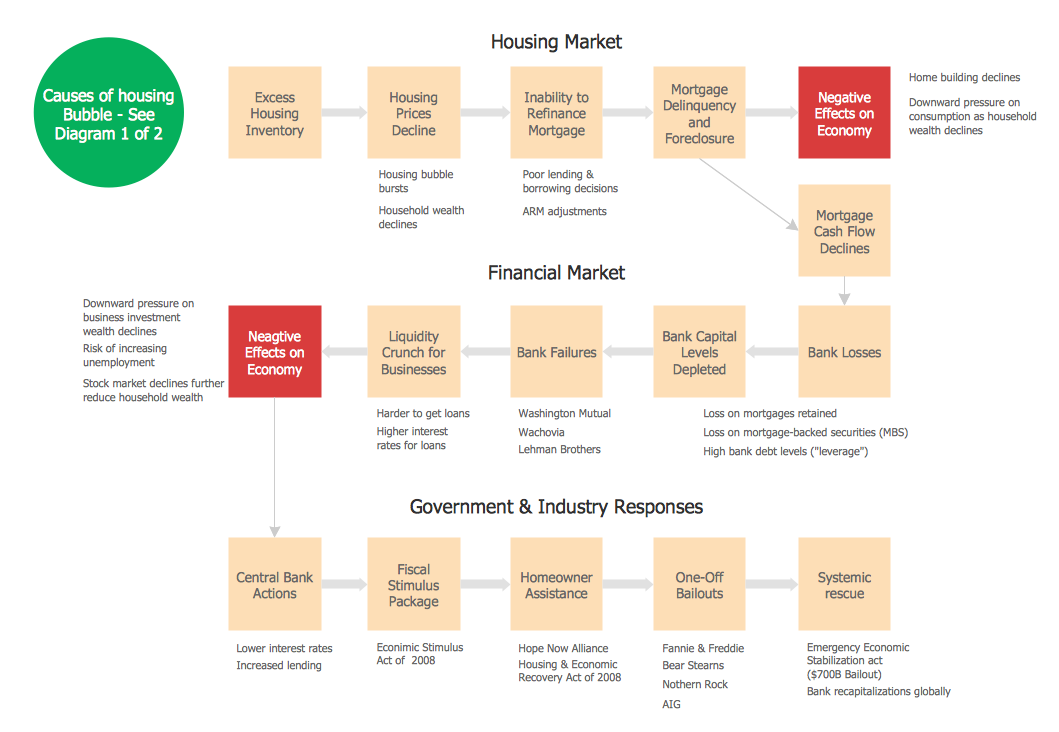
This sample was created in ConceptDraw DIAGRAM diagramming and vector drawing software using the Flowcharts solution from the Diagrams area of ConceptDraw Solution Park. This sample shows the Flowchart of the Subprime Mortgage Crisis. This Flowchart describes the decline in housing prices when the housing bubble burst and what it caused on the housing and financial markets. You can also see the Government and Industry responses in this crisis situation.
Affinity Diagram
The affinity diagram is a business tool used to organize ideas and data. It is one of the Seven Management and Planning Tools. But how design the Affinity Diagram quick and easy? ConceptDraw DIAGRAM diagramming and vector drawing software offers the Seven Management and Planning Tools Solution from the Management Area.Pyramid Diagram
The Project Management Triangle Diagram depicts three main constraints of any project: scope, time and cost. Projects have to comply with the specified scope, projects should be finished in time and projects need to consume the budget. Each of the constraints represents one side of the triangle, and any change in budget or timing or scope affects the entire diagram. This diagram was made using ConceptDraw Office suite including best marketing project management software extended with collection of tools for creative project management software and project management reporting software symbols.Stakeholder Onion Diagram Template
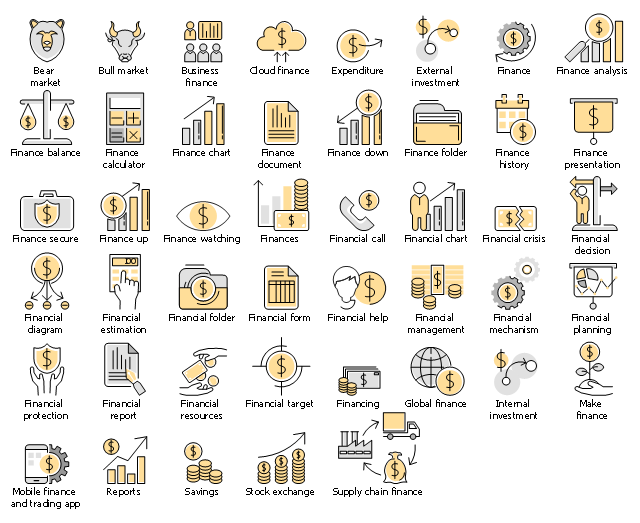
For depicting the onion model are actively used Stakeholder Onion Diagrams. The ConceptDraw DIAGRAM diagramming and vector drawing software extended with Stakeholder Onion Diagrams Solution from the Management Area of ConceptDraw Solution Park offers the number of useful tools and Stakeholder Onion Diagram template for their easy design.The vector stencils library "Finances" contains 45 finance icons.
"Finance is a field that deals with the study of investments. It includes the dynamics of assets and liabilities over time under conditions of different degrees of uncertainty and risk. Finance can also be defined as the science of money management. Finance aims to price assets based on their risk level and their expected rate of return. Finance can be broken into three different sub-categories: public finance, corporate finance and personal finance." [Finance. Wikipedia]
Use it to design your financial infographics.
Funnel Chart
Making a chart such as a funnel one may be a challenge for those who do not have as much experience in creating it. For this reason, as well as for time-saving sake, the Funnel Diagrams solution was introduced in order to simplify any ConceptDraw DIAGRAM user’s process of creating the funnel charts. This Funnel Diagrams solution includes the pre-made design elements in the stencil libraries and the templates of such charts.How To Create Onion Diagram
An onion diagram is a kind of chart that shows the dependencies among parts of an organization or process. The chart displays items in concentric circles, where the items in each ring depend on the items in the smaller rings. The Onion Diagram is able to show layers of a complete system in a few circles. But how to create Onion Diagram? Now, it's very easy thanks to the ConceptDraw DIAGRAM diagramming and vector drawing software extended with Stakeholder Onion Diagrams Solution from the Management Area of ConceptDraw Solution Park.Onion Diagram Templates
The Onion Diagram is a type of circular diagram which consists of the core circle and concentric circles that look like the cross sections of onion. The key value of the Onion Diagram is to visually demonstrate the relationships that lead to a successful final product or deliverable. Design of Onion Diagrams and Stakeholder Onions Diagrams is a complex process, but ConceptDraw DIAGRAM diagramming and vector drawing software makes it easier thanks to the Stakeholder Onion Diagrams Solution from the Management Area of ConceptDraw Solution Park, and the set of included libraries and Onion Diagram templates.- DroidDia PRO unlocker | Management Vector Icon Png
- Management pictograms | Operations Management Icon Png
- 25 Typical Orgcharts | Middle Management Icon Png
- Management pictograms | Investment Icon Vector Png
- Management pictograms | Investment Management Icons
- DroidDia PRO unlocker | Pr Management Icon Png
- Management pictograms - Vector stencils library | Design elements ...
- Management pictograms - Vector stencils library | ERD Symbols and ...
- Management pictograms - Management | External Management Icon
- Management pictograms | Accountancy Knowledgel Icon Png


