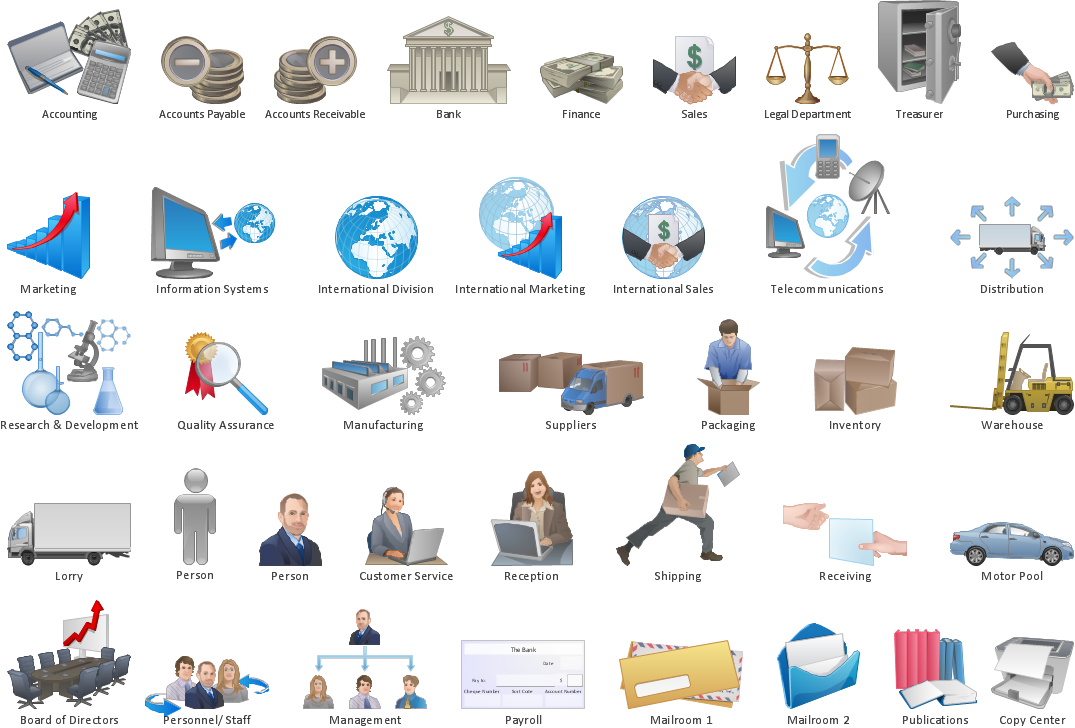
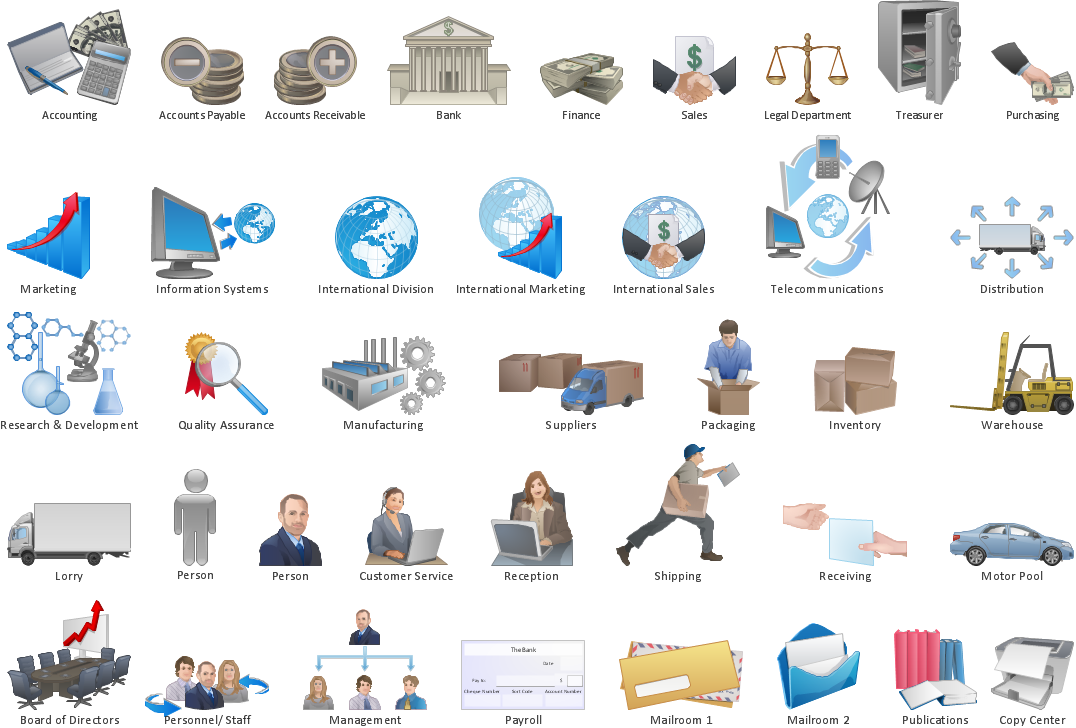
The vector stencils library "Workflow management" contains 22 icons.
Use it to design your business process workflow diagrams with ConceptDraw PRO software.
"Management in businesses and organizations is the function that coordinates the efforts of people to accomplish goals and objectives by using available resources efficiently and effectively.
Management includes planning, organizing, staffing, leading or directing, and controlling an organization to accomplish the goal or target. Resourcing encompasses the deployment and manipulation of human resources, financial resources, technological resources, and natural resources." [Management. Wikipedia]
The icons example "Design elements - Workflow management" is included in the Business Process Workflow Diagrams solution from the Business Processes area of ConceptDraw Solution Park.
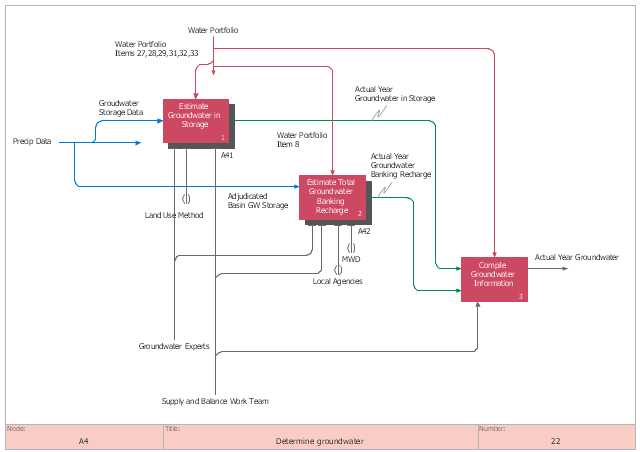
This IDEF0 diagram sample was created on the base of the figure from the California Water Plan website. [waterplan.water.ca.gov/ technical/ cwpu2009/ flowdiaghtml/ dgm18.htm]
"The California Water Plan provides a collaborative planning framework for elected officials, agencies, tribes, water and resource managers, businesses, academia, stakeholders, and the public to develop findings and recommendations and make informed decisions for California's water future. The plan, updated every five years, presents the status and trends of California's water-dependent natural resources; water supplies; and agricultural, urban, and environmental water demands for a range of plausible future scenarios. The California Water Plan also evaluates different combinations of regional and statewide resource management strategies to reduce water demand, increase water supply, reduce flood risk, improve water quality, and enhance environmental and resource stewardship. The evaluations and assessments performed for the plan help identify effective actions and policies for meeting California's resource management objectives in the near term and for several decades to come." [waterplan.water.ca.gov]
The IDEF0 diagram example "Determine groundwater" was created using the ConceptDraw PRO diagramming and vector drawing software extended with the IDEF0 Diagrams solution from the Software Development area of ConceptDraw Solution Park.
Affinity Diagram
The affinity diagram is a business tool used to organize ideas and data. It is one of the Seven Management and Planning Tools. But how design the Affinity Diagram quick and easy? ConceptDraw PRO diagramming and vector drawing software offers the Seven Management and Planning Tools Solution from the Management Area.Pyramid Diagram
The Project Management Triangle Diagram depicts three main constraints of any project: scope, time and cost. Projects have to comply with the specified scope, projects should be finished in time and projects need to consume the budget. Each of the constraints represents one side of the triangle, and any change in budget or timing or scope affects the entire diagram. This diagram was made using ConceptDraw Office suite including best marketing project management software extended with collection of tools for creative project management software and project management reporting software symbols.Decision Making
Decision Making - ConceptDraw Office suite provides visual tools that are given support on the stage of the decision making. The Seven Management and Planning Tools is a set for such diagrams: Affinity Diagram, Relations Diagram, Prioritization Matrix, Root Cause Tree Diagram, Involvement Matrix, PERT Chart, Risk Diagram (PDPC).
How to Draw a Good Diagram of a Business Workflow?
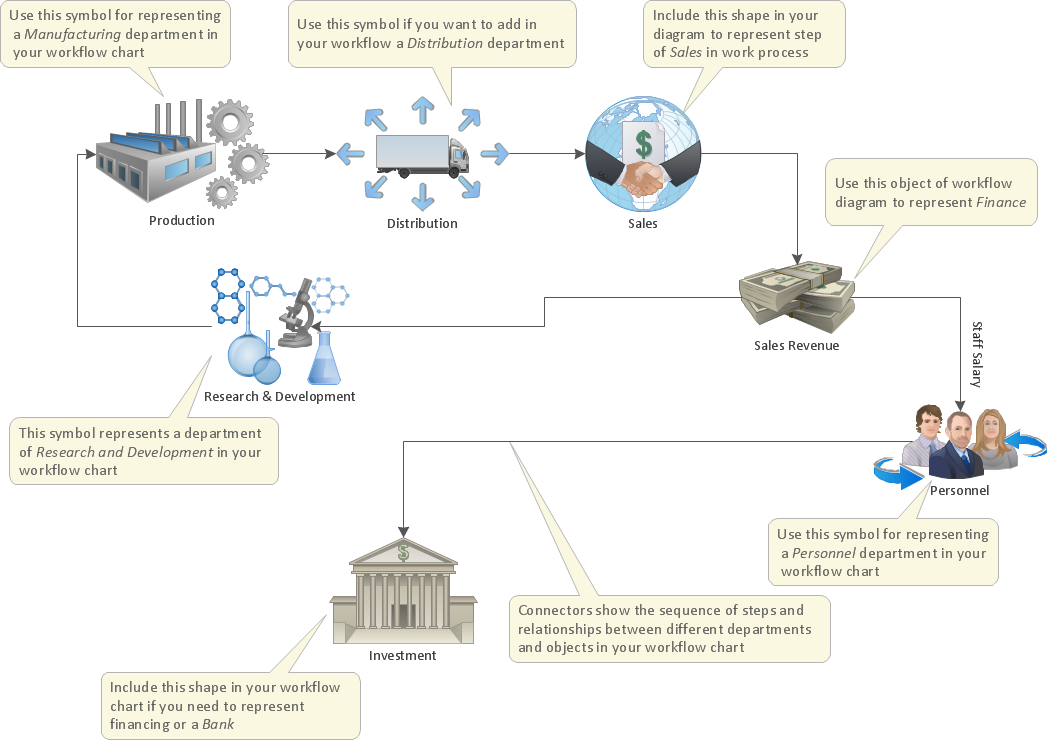
To draw a good diagram of a business workflow you should have a ready-to-use set of pre-designed objects you may drag-and-drop to your document focusing on the workflow structure and meaning, not drawing tools. ConceptDraw PRO with Workflow Diagrams solution provides complete set of design element you may use to draw a good diagram of a business workflow.How to Design a Good Workflow
To design a good workflow you have to focus on process analysis, not using the a drawing tool. This is more possible with ConceptDraw PRO software that brings the most natural drawing manner you have ever tried. First, define steps and procedures using simple rectangle shape, then select all shapes and click the Chain button to connect all shapes just in one click. After that you are able to modify some relations if needed.Optimize a Workflow
The first step to optimize a workflow is to get its visual depiction. Then you can analyse and optimize the workflow making changes to your workflow diagram. We recommend to use ConceptDraw PRO software extended with the Workflow Diagram solution to visualize and optimize your workflow. It allows you produce easy-to-change scalable vector graphic workflow and then present it to your team or partners.Top iPad Business Process Diagrams Apps
Review of Business Process Diagram iPad Apps.Affinity Diagram
The Affinity Diagram, also known as a KJ diagram, is a business tool invented for organization the large quantity of ideas and data. It is a part of Seven Management and Planning Tools, it is usually used right after brainstorming to sort large numbers of ideas into the corresponding groups. The Affinity Diagram helps to represent in a better way the structure of large and complex factors which influence on a problem, divides these factors into the smaller and simpler structures, and helps team members to see the patterns and identify possible solutions to problems they have. The diagrams of this type don't show the causal relationships between the factors, but they are designed to prepare the data for holding further analysis of the cause-effect relationships. Another area of Affinity Diagram usage is contextual inquiry as a way to sort observations and notes from field interviews, support call logs, open-ended survey responses organizing, etc. ConceptDraw MINDMAP software offers you the tools for easy holding brainstorming, generation ideas and creation MINDMAP Affinity Diagram.Bar Diagram Math
ConceptDraw PRO extended with Divided Bar Diagrams solution from Graphs and Charts area of ConceptDraw Solution Park is the best software for quick and simple drawing the Divided Bar Diagrams and Bar Diagram Math.Work Flow Process Chart
Workflow Diagram - workflow process diagram is a visual representation of a organizational process flow. Often it used as the same visual notation as process flow diagram. Visualising business processes using workflow diagram (workflow process diagram) allows estimate business process efficiency, analyse and optimize the process itself. Workflow diagram helps get focusing on each step and relations between workflow steps. ConceptDraw PRO is software for making workflow diagram. It contains specific designed graphics to draw workflow diagrams effectively. This is workflow diagram maker which do your work process effective.How to Draw Workflow Diagram
To draw workflow diagram you should find a perfect software first. We recommend using ConceptDraw PRO software contains all features you may need to draw diagrams faster. ConceptDraw PRO software extended with the Workflow Diagrams solution gives you everything you need to draw workflow diagram.Drawing Workflow Diagrams
Drawing workflow diagrams combines both creative and analytic practice. To be the most effective in this process you should find a software that suites this kind of practice. Using ConceptDraw PRO software for drawing workflow diagrams you get support of features, libraries, templates and samples boosts you creativity and keep you focus on analytic practice, not drawing specifics.- Management Of Natural Resource In Mathematics Pie Chart
- Natural Resources Diagrams
- Energy resources diagram | | | Natural Resources Pie Chart
- Energy resources diagram | Chart On Conservation Of Natural ...
- Natural Resources And Their Management In Bargrap Data
- Natural Resources Management Bar Chart
- Examples Of Natural Resources Graph Pic
- Pie Chart On Management Of Natural Resources
- Chart Which Can Be Prepared On Natural Resource Management
- Natural Resources Bar Graph Maths
- Pie Chart On Natural Resource Management
- Natural Resources Diagram
- Natural Resources Pie Chart Graphs
- Graph Of Conservation Of Natural Resources
- Natural Resources Bar Graph
- Bar Graph And Pie Chart About Management Of Natural Resourses
- Graph On Management Of Natural Resources
- Pie Chart Of Conservation Of Natural Resources
- Images Of Natural Resource Management Related To Math
- Management Of Natural Resourses In Mathmatics With Pie Chart
