Venn Diagram Maker
ConceptDraw DIAGRAM diagramming and vector drawing software extended with Venn Diagrams solution from the "Diagrams" area of ConceptDraw Solution Park is a powerful Venn Diagram maker. Create fast and easy your own Venn Diagrams to visualize: all the possible logical relations between sets, simple set relationships in logic, statistics, mathematics, sociology, marketing, summarize the status and future viability of a project.Management Tools — Total Quality Management
The Total Quality Management Diagram solution helps your organization visualize business and industrial processes. Create Total Quality Management diagrams for business process with ConceptDraw software.Venn Diagrams
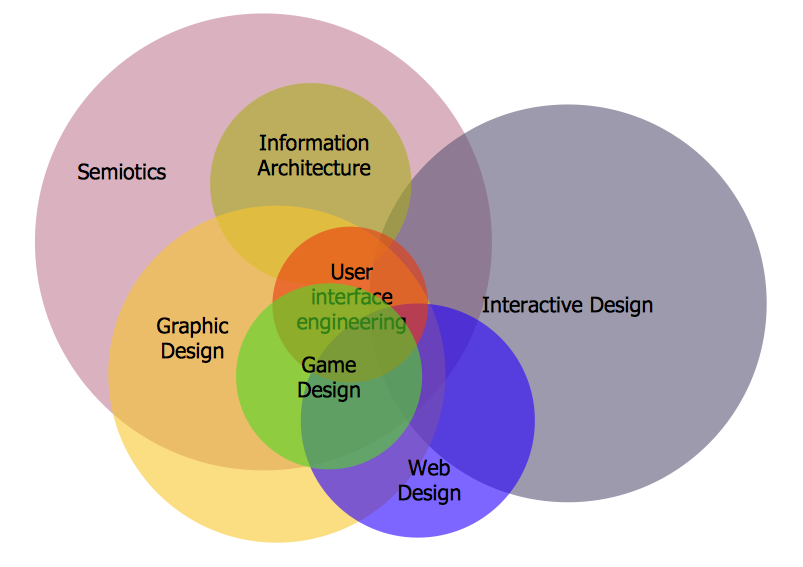
Venn Diagrams are actively used to illustrate simple set relationships in set theory and probability theory, logic and statistics, mathematics and computer science, linguistics, sociology, and marketing. Venn Diagrams are also often used to visually summarize the status and future viability of a project.
Venn Diagram Examples for Problem Solving. Environmental Social Science. Human Sustainability Confluence
The Venn diagram example below shows sustainable development at the confluence of three constituent parts.Create your Venn diagrams for problem solving in environmental social science using the ConceptDraw DIAGRAM diagramming and vector drawing software extended with the Venn Diagrams solution from the area "Diagrams" of ConceptDraw Solution Park.
Using Fishbone Diagrams for Problem Solving
Problems are obstacles and challenges that one should overcome to reach the goal. They are an inseparable part of any business, and the success of an enterprise often depends on ability to solve all problems effectively. The process of problem solving often uses rational approach, helping to find a suitable solution.Using Fishbone Diagrams for Problem Solving is a productive and illustrative tool to identify the most important factors causing the trouble. ConceptDraw DIAGRAM extended with Fishbone Diagrams solution from the Management area of ConceptDraw Solution Park is a powerful tool for problem solving with Fishbone Ishikawa diagram graphic method.
Interactive Venn Diagram
Venn Diagrams Solution offers you the Venn Diagrams library of ready-to-use vector objects and large collection of templates and samples allowing you create your own Interactive Venn Diagram in minutes.Venn Diagrams designed in ConceptDraw DIAGRAM are visual, bright, colorful, so they can be successfully used in different reports, appearances on the conferences, meetings.
ConceptDraw Solution Park
ConceptDraw Solution Park collects graphic extensions, examples and learning materials
Visual Presentations Made Easy with Diagramming Software
Automatically create a presentation-quality diagram in one click with ConceptDraw DIAGRAM.SWOT Analysis Tool for Small Business
SWOT analysis is a method of the making plan to evaluate the Strengths, Weaknesses, Opportunities, and Threats involved in a project. It involves specifying the objective of the project and identifying the internal and external causes for the accomplishing project goals.Best Tool for Infographic Construction
ConceptDraw is a best data visualization tool that will allow everyone to create rich infographics and visualizations quickly and easily.Venn Diagram Template for Word
This template shows the Venn Diagram. It was created in ConceptDraw DIAGRAM diagramming and vector drawing software using the ready-to-use objects from the Venn Diagrams Solution from the "Diagrams" area of ConceptDraw Solution Park.Venn Diagram Examples for Problem Solving. Venn Diagram as a Truth Table
Venn diagrams are illustrations used in the branch of mathematics known as set theory. They show the mathematical or logical relationship between different groups of things (sets). A Venn diagram shows all the possible logical relations between the sets.3 Circle Venn Diagram. Venn Diagram Example
This template shows the Venn Diagram. It was created in ConceptDraw DIAGRAM diagramming and vector drawing software using the ready-to-use objects from the Venn Diagrams Solution from the "Diagrams" area of ConceptDraw Solution Park.Venn Diagrams visualize all possible logical intersections between several sets and are widely used in mathematics, logic, statistics, marketing, sociology, etc.
SWOT Analysis
The SWOT Analysis provides information that is helpful in matching the firm's resources and capabilities to the competitive environment in which it operates. As such, it is instrument in strategy formulation and selection. SWOT analysis is a method of strategic planning which identifies the factors internal and external environment of the firm and divides them into 4 categories: strengths, weaknesses, opportunities and threats. The ConceptDraw DIAGRAM and MINDMAP software allow professional to make well-designed SWOT matrix in minutes.Venn Diagram Examples for Problem Solving
In the Venn Diagrams solution, there are the pre-made examples that can be always used for making the unique, great looking diagrams, such as the 2-set Venn ones of any needed colour, the 3-set one, the 4-set ones and the 5-set ones. Having the already previously created samples of the Venn diagrams can help any ConceptDraw DIAGRAM user make it possible to make the needed drawing within only a few minutes by editing the existing ones.- Using Fishbone Diagrams for Problem Solving | Venn Diagram ...
- Entity-Relationship Diagram (ERD) | Management Tools — Total ...
- Multi Layer Venn Diagram . Venn Diagram Example | Management ...
- 2-Set Venn diagram - Template | Probability Quality Control Tools ...
- 4-Set Venn diagram - Template | Seven Management and Planning ...
- Seven Management and Planning Tools | Venn Diagram Template ...
- CORRECTIVE ACTIONS PLANNING. Risk Diagram (PDPC) | Venn ...
- Management Tools — Total Quality Management | Multi Layer Venn ...
- Mathematics | Pie Charts | Venn Diagrams | Disaster Management ...
- Cause and effect diagram - Increase in productivity | Total Quality ...
- Construction Project Chart Examples | 3 Circle Venn. Venn Diagram ...
- Venn Diagram Template for Word | Mathematical Diagrams ...
- Path to sustainable development | Venn Diagram Examples for ...
- 4-Set Venn diagram - Template | Seven Management and Planning ...
- Venn Diagram Examples for Problem Solving. Environmental Social ...
- SWOT Analysis | Venn Diagram Template for Word | Business ...
- Total Quality Management TQM Diagrams | Process Flowchart ...
- Use Case Diagram For Electronic Library Management System
- Venn Diagram Examples for Problem Solving. Environmental Social ...
- Probability Quality Control Tools | How to Create a Venn Diagram in ...
- ERD | Entity Relationship Diagrams, ERD Software for Mac and Win
- Flowchart | Basic Flowchart Symbols and Meaning
- Flowchart | Flowchart Design - Symbols, Shapes, Stencils and Icons
- Flowchart | Flow Chart Symbols
- Electrical | Electrical Drawing - Wiring and Circuits Schematics
- Flowchart | Common Flowchart Symbols